News Tsunami Doesn’t Dampen Markets

Good Morning Traders,
As of this writing 4:10 AM EST, here’s what we see:
US Dollar: Dec. USD is Up at 94.735.
Energies: Oct '18 Crude is Up at 72.28.
Financials: The Dec 30 year bond is Up 4 ticks and trading at 140.25.
Indices: The Dec S&P 500 emini ES contract is 8 ticks Lower and trading at 2918.00.
Gold: The Dec Gold contract is trading Down at 1186.70. Gold is 7 ticks Lower than its close.
Initial Conclusion
This is not a correlated market. The dollar is Up+ and Crude is Up+ which is not normal and the 30 year Bond is trading Higher. The Financials should always correlate with the US dollar such that if the dollar is lower then bonds should follow and vice-versa. The S&P is Lower and Crude is trading Higher which is correlated. Gold is trading Down- which is correlated with the US dollar trading Higher. I tend to believe that Gold has an inverse relationship with the US Dollar as when the US Dollar is down, Gold tends to rise in value and vice-versa. Think of it as a seesaw, when one is up the other should be down. I point this out to you to make you aware that when we don't have a correlated market, it means something is wrong. As traders you need to be aware of this and proceed with your eyes wide open.
At this hour Asia is trading mainly Higher with the exception of the Sensex exchange which is Lower. Currently all of Europe is trading Lower.
Possible Challenges To Traders Today
-
Core PCE Price Index is out at 8:30 AM EST. This is major.
-
Personal Spending is out at 8:30 AM EST. This is major.
-
Personal Income is out at 8:30 AM EST. This is major.
-
Chicago PMI is out at 9:45 AM EST. This is major.
-
Revised UoM Consumer Sentiment is out at 10 AM EST. This is not major.
-
Revised UoM Inflation Expectations is out at 10 AM. This is not major.
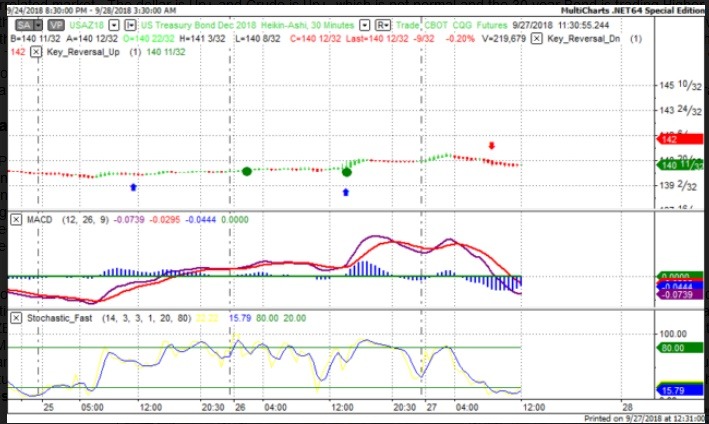
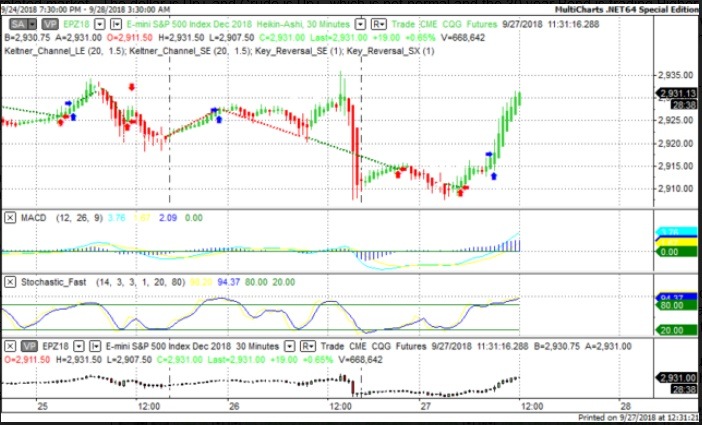
Treasuries
We've elected to switch gears a bit and show correlation between the 30 year bond (ZB) and The YM futures contract. The YM contract is the DJIA and the purpose is to show reverse correlation between the two instruments. Remember it's liken to a seesaw, when up goes up the other should go down and vice versa.
Yesterday the ZB made it's move at around 9 AM EST. The ZB hit a High at around that time and the YM hit a Low. If you look at the charts below ZB gave a signal at around 9 AM EST and the YM was moving Higher at the same time. Look at the charts below and you'll see a pattern for both assets. ZB hit a High at around 9 AM and the YM was moving Higher at the same time. These charts represent the newest version of MultiCharts and I've changed the timeframe to a 30 minute chart to display better. This represented a Shorting opportunity on the 30 year bond, as a trader you could have netted about 10 plus ticks per contract on this trade. Each tick is worth $31.25.
Charts Courtesy of MultiCharts built on an AMP platform.
Bias
Yesterday we gave the markets a Neutral bias as the indices had no sense of direction yesterday morning. The Dow gained 55 points and the other indices gained ground as well. Today we aren't dealing with a correlated market and our bias is to the downside.
Could this change? Of Course. Remember anything can happen in a volatile market.
Commentary
Yesterday we had 10 economic reports, all of which were major and proven market movers yet the markets didn't falter which will attest for the strength of this market. Not all economic news reported was positive but at the end of the day it didn't matter as the markets finished higher anyway. Today we have half a dozen economic reports and not all of them are major, so it will be interesting to see what the markets do today.
Author

Nick Mastrandrea
Market Tea Leaves


