News tsunami cometh [Video]
![News tsunami cometh [Video]](https://editorial.fxstreet.com/images/Markets/Commodities/Metals/Gold/gold-coins-on-a-weight-scale-gm173237086-20246712_XtraLarge.jpg)
US Dollar: June USD is Up at 99.300.
Energies: June'20 Crude Up at 34.20.
Financials: The June'20 30 year bond is Up 9 ticks and trading at 179.29.
Indices: The June S&P 500 emini ES contract is 74 ticks Lower and trading at 2949.50.
Gold: The June '20 Gold contract is trading Down at 1733.80. Gold is 182 ticks Lower than its close.
Initial Conclusion
This is not a correlated market. The dollar is Up+ and Crude is Up+ which is not normal and the 30 year Bond is trading Higher. The Financials should always correlate with the US dollar such that if the dollar is lower then bonds should follow and vice-versa. The S&P is Lower and Crude is trading Higher which is correlated. Gold is trading Higher which is correlated with the US dollar trading Down. I tend to believe that Gold has an inverse relationship with the US Dollar as when the US Dollar is down, Gold tends to rise in value and vice-versa. Think of it as a seesaw, when one is up the other should be down. I point this out to you to make you aware that when we don't have a correlated market, it means something is wrong. As traders you need to be aware of this and proceed with your eyes wide open.
At this time Asia is trading mainly Lower with the exception of the Indian Sensex exchange. Currently all of Europe is trading Lower.
Possible Challenges To Traders Today:
-
Philly Fed Manufacturing Index is out at 8:30 AM EST. This is Major.
-
Unemployment Claims are out at 8:30 AM EST. This is Major.
-
Flash Manufacturing PMI is out at 9:45 AM EST. This is Major.
-
Flash Services PMI is out at 9:45 AM EST. This is Major.
-
CB Leading Index m/m is out at 10 AM EST. This is Major.
-
Existing Home Sales is out at 10 AM EST. This is Major.
-
FOMC Member Williams Speaks at 10 AM EST. This is Major.
-
Natural Gas Storage is out at 10:30 AM EST. This is Major.
-
FOMC Member Clarida Speaks at 1 PM EST. This is Major.
-
Fed Chair Powell Speaks at 2 PM EST. This is major.
Treasuries
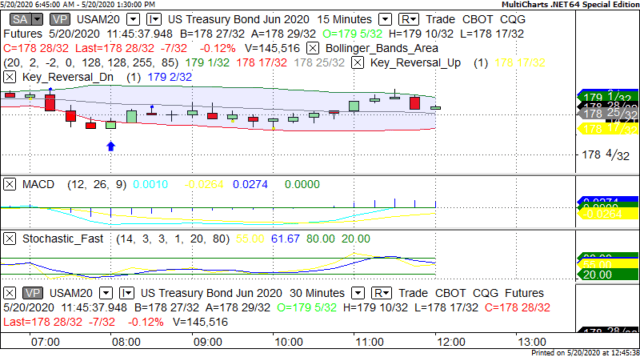
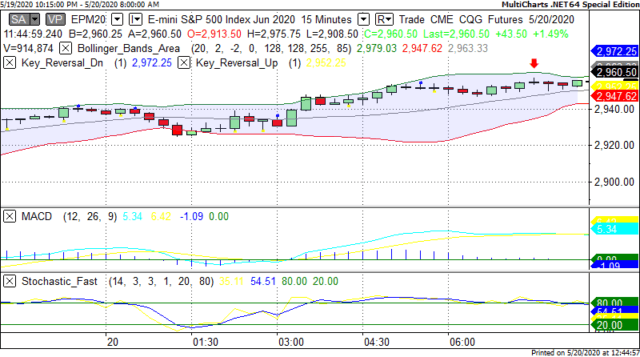
We've elected to switch gears a bit and show correlation between the 30 year bond (ZB) and The S&P futures contract. The S&P contract is the Standard and Poor's and the purpose is to show reverse correlation between the two instruments. Remember it's liken to a seesaw, when up goes up the other should go down and vice versa.
Yesterday the ZB made it's move at around 8 AM EST. The ZB hit a Low at around that time and the S&P moved Lower. If you look at the charts below ZB gave a signal at around 8 AM and the S&P moved Lower at around the same time. Look at the charts below and you'll see a pattern for both assets. ZB hit a Low at around 8 AM EST and the S&P was moving Lower shortly thereafter. These charts represent the newest version of MultiCharts and I've changed the timeframe to a 15 minute chart to display better. This represented a Long opportunity on the 30 year bond, as a trader you could have netted about 30 plus ticks per contract on this trade. Each tick is worth $31.25. Please note: the front month for the ZB is now June '20. The S&P contract is now June '20 as well. I've changed the format to Renko bars such that it may be more apparent and visible.
Charts Courtesy of MultiCharts built on an AMP platform
Bias
Yesterday we gave the markets a Neutral bias as all the instruments used for Market Correlation were pointed Higher and as such there wasn't any real correlation. The Dow gained 369 points and the other indices gained ground as well. Today we aren't dealing with a correlated market and our bias is to the Downside.
Could this change? Of Course. Remember anything can happen in a volatile market.
Commentary
Yesterday we gave the markets a Neutral bias as all instruments we use for market correlation purposes were pointed Higher and as such there is no true correlation. The same would hold true if everything was pointed Lower. This situation reminds us of a "Dead Cat Bounce" whereby the markets rise after falling (as it did on Tuesday). Most of this could be from short covering where the market rises in an attempt for traders to take money off the table. The danger here come in the form of "one day up", next day down. Traders get too used to that idea and whereas that might work for a while, sooner or later it doesn't. Subscribers to this newsletter will not have that concern as we will always dissect the markets and give you a true opinion and we will analyze each day before the markets open. Just remember that anything can happen in a volatile market.
Author

Nick Mastrandrea
Market Tea Leaves


