News Tsunami Cometh

Good Morning Traders,
As of this writing 5:20 AM EST, here’s what we see:
US Dollar: March USD is Down at 96.935.
Energies: Feb'20 Crude is Up at 58.02.
Financials: The Mar'20 30 year bond is Down 1 tick and trading at 158.15.
Indices: The March S&P 500 emini ES contract is 33 ticks Higher and trading at 3302.00.
Gold: The Feb'20 Gold contract is trading Up at 1555.40. Gold is 14 ticks Higher than its close.
Initial Conclusion
This is not a correlated market. The dollar is Down- and Crude is Up+ which is normal and the 30 year Bond is trading Lower. The Financials should always correlate with the US dollar such that if the dollar is lower then bonds should follow and vice-versa. The S&P is Higher and Crude is trading Higher which is not correlated. Gold is trading Higher which is correlated with the US dollar trading Down. I tend to believe that Gold has an inverse relationship with the US Dollar as when the US Dollar is down, Gold tends to rise in value and vice-versa. Think of it as a seesaw, when one is up the other should be down. I point this out to you to make you aware that when we don't have a correlated market, it means something is wrong. As traders you need to be aware of this and proceed with your eyes wide open.
At this time all of Asia is trading to the Upside with the exception of the Shanghai exchange which is Lower. Currently Europe is trading mainly Lower with the exception of the Paris and Milan exchanges which are Higher at this time.
Possible Challenges To Traders Today:
Retail Sales is out at 8:30 AM EST. This is Major.
Core Retail Sales is out at 8:30 AM EST. This is Major.
Philly Fed Manufacturing Index is out at 8:30 AM EST. This is Major.
Import Prices are out at 8:30 AM EST. This is Major.
Unemployment Claims are out at 8:30 AM EST. This is Major.
FOMC Member Bowman Speaks at 10 AM EST. This is Major.
Business Inventories is out at 10 AM EST. This is not Major.
NAHB Housing Market Index is out at 10 AM EST. This is Major.
Natural Gas Storage is out at 10:30 AM EST. This is Major.
TIC Long-Term Purchases is out at 4 PM EST. This is not Major.
Treasuries
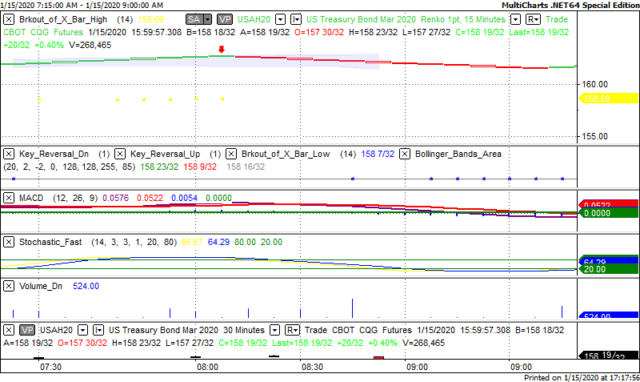
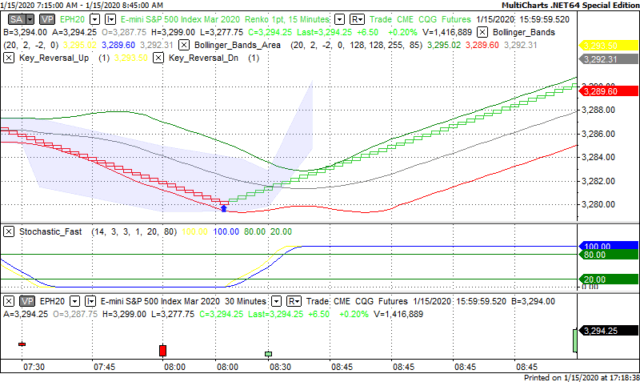
We've elected to switch gears a bit and show correlation between the 30 year bond (ZB) and The S&P futures contract. The S&P contract is the Standard and Poor's and the purpose is to show reverse correlation between the two instruments. Remember it's liken to a seesaw, when up goes up the other should go down and vice versa.
Yesterday the ZB made a major move at around 8 AM EST. The ZB hit a High at around that time and the S&P moved Higher. If you look at the charts below ZB gave a signal at around 8 AM EST and the S&P moved Higher at the same time. Look at the charts below and you'll see a pattern for both assets. ZB hit a High at around 8 AM and the S&P was moving Higher shortly thereafter. These charts represent the newest version of MultiCharts and I've changed the timeframe to a 15 minute chart to display better. This represented a Shorting opportunity on the 30 year bond, as a trader you could have netted about 12 ticks per contract on this trade. Each tick is worth $31.25. Please note: the front month for the ZB is now March '20. The S&P contract is also March '20. I've changed the format to Renko bars such that it may be more apparent and visible.
Charts Courtesy of MultiCharts built on an AMP platform.
Bias
Yesterday we gave the markets a Neutral bias as we saw no real evidence of market correlation, hence the Neutral bias. The Dow traded Higher by 91 points and the other indices gained ground as well. Today we aren't dealing with a correlated market and our bias is to the Upside.
Could this change? Of Course. Remember anything can happen in a volatile market.
Commentary
It appears as though phase one of the trade agreement with China was concluded yesterday and the markets applauded this news by trading Higher. The Dow, S&P and Nasdaq all ended in positive territory Wednesday. Today we have about 10 economic reports, most of which are major and proven market movers, hence the news tsunami. Will this impact the markets? Only time will tell...
Author

Nick Mastrandrea
Market Tea Leaves


