NZD/USD Elliott Wave technical analysis [Video]
![NZD/USD Elliott Wave technical analysis [Video]](https://editorial.fxstreet.com/images/Markets/Currencies/Majors/NZDUSD/new-zealand-currency-background-35848870_XtraLarge.jpg)
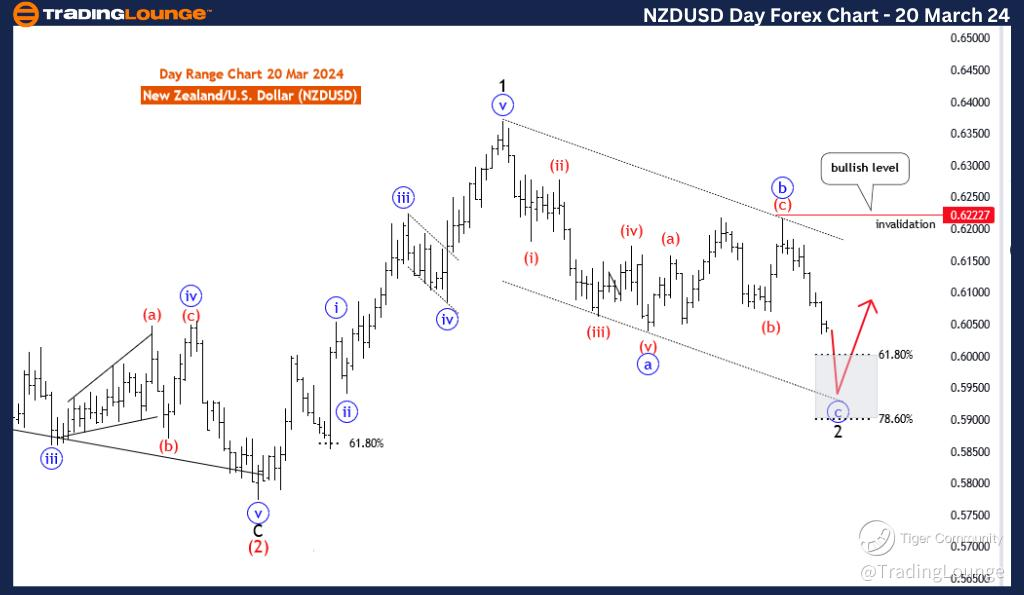
NZDUSD Elliott Wave Analysis Trading Lounge Day Chart, 20 March 24.
New Zealand Dollar/U.S.Dollar(NZDUSD) Day Chart.
NZD/USD Elliott Wave technical analysis
Function: Counter Trend.
Mode: Impulsive as C.
Structure: Blue wave C.
Position: Black wave 2.
Direction next higher degrees: Black wave 3.
DETAILS blue wave B of 2 looking completed 0.62227. Now blue wave C is in play. Wave Cancel invalid level: 0.62227.
The NZD/USD Elliott Wave Analysis for the day chart on 20 March 24, provides insights into the potential price movements of the New Zealand Dollar/U.S. Dollar currency pair using Elliott Wave principles within technical analysis.
Identified as a "Counter Trend" scenario, the analysis suggests a deviation from the prevailing trend, indicating a potential corrective phase in the market. This implies that the current price movement opposes the predominant trend direction, offering traders opportunities to capitalize on potential reversals.
Described as "Impulsive as C" in mode, the analysis indicates that the current price action is exhibiting characteristics of impulsiveness within the context of a corrective phase. This suggests strong and directional movement in the market, potentially leading to significant price swings.
The "STRUCTURE" is labeled as "blue wave C," indicating that the market is currently undergoing a corrective phase within the larger Elliott Wave count. This suggests that the current price movement is part of a corrective wave within a broader Elliott Wave cycle.
Positioned as "black wave 2," the analysis suggests that the current corrective phase is part of a higher-degree Elliott Wave cycle. This implies that the corrective movement is occurring within the context of a larger corrective structure, providing traders with insights into potential price targets and trend reversals.
The "DIRECTION NEXT HIGHER DEGREES" is identified as "black wave 3," suggesting the expected direction for the subsequent higher-degree wave. This Indicates that once the current corrective phase completes, the market may resume its upward movement in the higher-degree Elliott Wave cycle.
In the "DETAILS" section, it is mentioned that "blue wave B of 2 looking completed at 0.62227. Now blue wave C is in play." This suggests that the current corrective phase has likely completed, and the market is now poised to continue its movement in the direction of the larger trend.
The "Wave Cancel invalid level" is specified as 0.62227, serving as a critical threshold. A breach beyond this level would invalidate the current wave count, necessitating a reassessment of the analysis.
In summary, the NZD/USD Elliott Wave Analysis for the day chart on 20 March 24, provides traders with valuable insights into potential price movements, corrective phases, and critical levels to monitor for trend reversals and trading opportunities.
NZDUSD Elliott Wave Analysis Trading Lounge 4 Hour Chart, 20 March 24
New Zealand Dollar/U.S.Dollar(NZDUSD) 4 Hour Chart
NZD/USD Elliott Wave technical analysis
Function: Counter Trend
Mode: Impulsive
Sturcture: Red wave 3
Position: Blue wave C
Direction nexthigher degrees: Red wave 4
DETAILS red wave 2 of C looking completed now red wave 3 is in play and looking near to end. Wave Cancel invalid level: 0.61333
The NZD/USD Elliott Wave Analysis for the 4-hour chart on 20 March 24, presents an assessment of the potential price movements of the New Zealand Dollar/U.S. Dollar currency pair using Elliott Wave principles within technical analysis.
Identified as a "Counter Trend" scenario, the analysis suggests a deviation from the prevailing trend, indicating a potential corrective phase in the market. This implies that the current price movement opposes the predominant trend direction, providing traders with insights into a potential reversal.
Described as "Impulsive" in mode, the analysis indicates that the current price action is exhibiting characteristics of impulsiveness, suggesting strong and directional movement within the corrective phase.
The "STRUCTURE" is labeled as "red wave 3," indicating that the market is currently undergoing a corrective phase within the larger Elliott Wave count. This suggests that the current price movement is part of a corrective wave within a broader Elliott Wave cycle.
Positioned as "blue wave C," the analysis indicates that the current corrective phase is part of a higher-degree Elliott Wave cycle. This implies that the corrective movement is occurring within the context of a larger corrective structure.
The "DIRECTION NEXT HIGHER DEGREES" is identified as "red wave 4," suggesting the expected direction for the subsequent higher-degree wave. This indicates that once the current corrective phase completes, the market may resume its upward movement in the higher-degree Elliott Wave cycle.
In the "DETAILS" section, it is mentioned that "red wave 2 of C looking completed now red wave 3 is in play and looking near to end." This suggests that the current corrective phase is expected to conclude soon, with the market likely to resume its upward movement thereafter.
The "Wave Cancel invalid level" is specified as 0.61333, serving as a critical threshold. A breach beyond this level would invalidate the current wave count, necessitating a reassessment of the analysis.
In summary, the NZD/USD Elliott Wave Analysis for the 4-hour chart on 20 March 24, suggests a counter-trend corrective scenario, providing insights into potential price movements and key levels to monitor for potential trend reversals.
Technical Analyst: Malik Awais.
NZD/USD Elliott Wave technical analysis [Video]
Author

Peter Mathers
TradingLounge
Peter Mathers started actively trading in 1982. He began his career at Hoei and Shoin, a Japanese futures trading company.


