NZD/USD Elliott Wave technical analysis [Video]
![NZD/USD Elliott Wave technical analysis [Video]](https://editorial.fxstreet.com/images/Markets/Currencies/Majors/NZDUSD/new-zealand-coins-62495786_XtraLarge.jpg)
NZD/USD Elliott Wave technical analysis
Function: Trend.
Mode: Impulsive.
Structure: Red wave 3.
Position: Blue Wave 1.
Direction next lower degrees: Red Wave 4.
Details: Red wave 2 of blue wave 1 looking completed at 0.60490.Now red wave 3 of 1 is in play Wave Cancel invalid level: 0.60674.
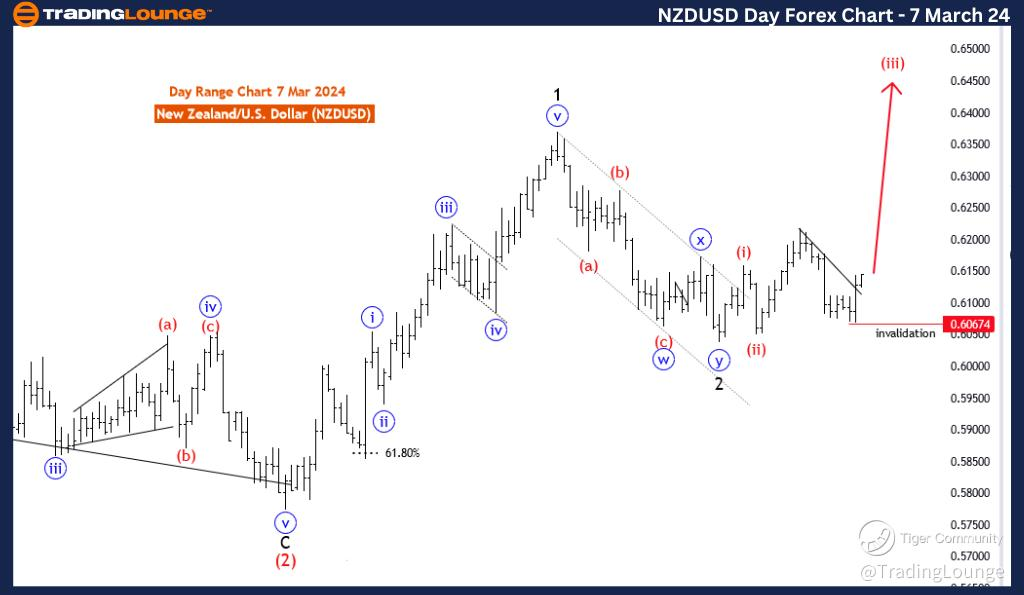
The NZDUSD Elliott Wave Analysis for the day chart on 7 March 24, offers a comprehensive view of the New Zealand Dollar/U.S. Dollar currency pair. Employing Elliott Wave principles, the analysis seeks to discern prevailing trends and potential future price movements within the overarching Elliott Wave structure.
The "FUNCTION" identified in the analysis is "Trend," indicating a strategy aligned with capturing and riding directional movements in the market. This implies an inclination towards trading in the direction of the existing trend.
The specified "MODE" is "Impulsive," signaling a market environment characterized by robust and forceful price actions. This suggests a prevailing momentum in the direction of the identified trend.
The described "STRUCTURE" is "Red wave 3," pointing to a specific phase within the broader Elliott Wave pattern. Red wave 3 typically signifies a mature phase of an impulsive trend, indicating significant progress in price.
The identified "POSITION" is "Blue wave 1," representing the current placement within the larger Elliott Wave structure. Blue wave 1 is a subwave within the red wave 3, indicating a continuation of the prevailing impulsive move.
Regarding "DIRECTION NEXT LOWER DEGREES," the focus is on "Red wave 4," implying an anticipation of a corrective phase following the completion of blue wave 1. This suggests a potential pause or pullback in the current uptrend.
In the "DETAILS" section, it is mentioned that "red wave 2 of blue wave 1 looking completed at 0.60490." This signifies the conclusion of a specific subwave within blue wave 1, and the analysis notes that "red wave 3 of 1 is in play."
The "Wave Cancel invalid level" is set at 0.60674, serving as a critical reference point. A breach beyond this level would invalidate the current wave count, prompting a reassessment of the analysis.
In summary, the NZDUSD Elliott Wave Analysis for the day chart on 7 March 24, underscores a trending strategy within an impulsive market environment. The focus is on the continuation of red wave 3, specifically red wave 3 of 1, with the Wave Cancel invalid level at 0.60674 acting as a crucial marker for potential shifts in the wave count and trend dynamics.
NZD/USD daily chart
NZD/USD Elliott Wave technical analysis
Function: Trend.
Mode: Impulsive.
Structure: Black wave 3.
Position: Red wave 3.
Direction next lower degrees: Black wave 4.
Details: Black wave 2 of red wave 3 looking completed at 0.60674. Now black wave 3 of 3 is in play Wave Cancel invalid level: 0.60674
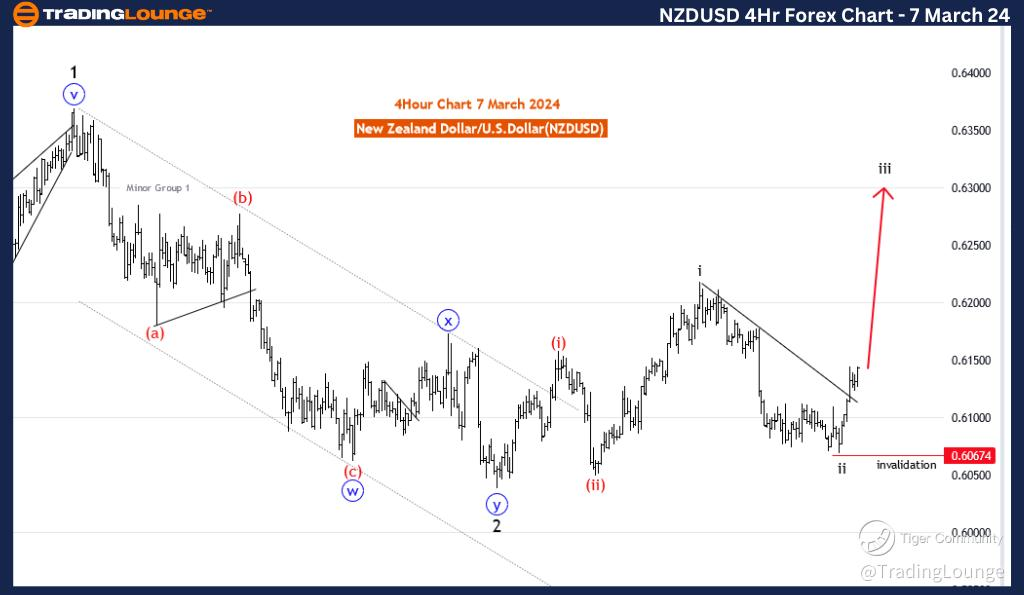
The analysis on the NZDUSD Elliott Wave Trading Lounge 4-hour chart for 7 March 24, provides insights into the New Zealand Dollar/U.S. Dollar currency pair using Elliott Wave principles. The analysis focuses on identifying trends and potential price movements within the broader Elliott Wave structure.
The identified "FUNCTION" is "Trend," indicating a focus on capturing and riding directional movements in the market. This suggests a strategy geared towards trading in the direction of the prevailing trend.
The specified "MODE" is "Impulsive," suggesting that the market is currently characterized by strong and forceful price movements. This implies a dominant directional momentum in the identified trend.
The described "STRUCTURE" is "Black wave 3," indicating the specific phase within the Elliott Wave pattern. This signifies a mature phase of the impulsive trend, suggesting significant advancements in price.
The identified "POSITION" is "Red wave 3," which represents the current placement within the larger Elliott Wave structure. Red wave 3 is a subwave within the black wave 3, indicating a continuation of the prevailing impulsive move.
Regarding "DIRECTION NEXT LOWER DEGREES," the focus is on "Black wave 4," implying the anticipation of a corrective phase following the completion of red wave 3. This suggests a potential pause or pullback in the current uptrend.
In the "DETAILS" section, it is mentioned that "black wave 2 of red wave 3 looking completed at 0.60674." This signifies the completion of a specific subwave within red wave 3, and the analysis notes that "black wave 3 of 3 is in play."
The "Wave Cancel invalid level" is set at 0.60674, serving as a critical reference point. A breach beyond this level would invalidate the current wave count, prompting a reassessment of the analysis.
In summary, the NZDUSD Elliott Wave Analysis for the 4-hour chart on 7 March 24, emphasizes a trending strategy within an impulsive market environment. The focus is on the continuation of black wave 3, specifically black wave 3 of 3, with the Wave Cancel invalid level at 0.60674 acting as a crucial marker for potential shifts in the wave count and trend dynamics.
NZD/USD four hour chart
NZD/USD Elliott Wave technical analysis [Video]
Author

Peter Mathers
TradingLounge
Peter Mathers started actively trading in 1982. He began his career at Hoei and Shoin, a Japanese futures trading company.


