Stocks: New Short-Term Uptrend Or Just Upward Correction Before Another Leg Down?

Briefly: In our opinion, speculative short positions are favored (with stop-loss at 2,410, and profit target at 2,200, S&P 500 index).
Our intraday outlook is bearish, and our short-term outlook is bearish. Our medium-term outlook remains neutral, following S&P 500 index breakout above last year's all-time high:
Intraday outlook (next 24 hours): bearish
Short-term outlook (next 1-2 weeks): bearish
Medium-term outlook (next 1-3 months): neutral
Long-term outlook (next year): neutral
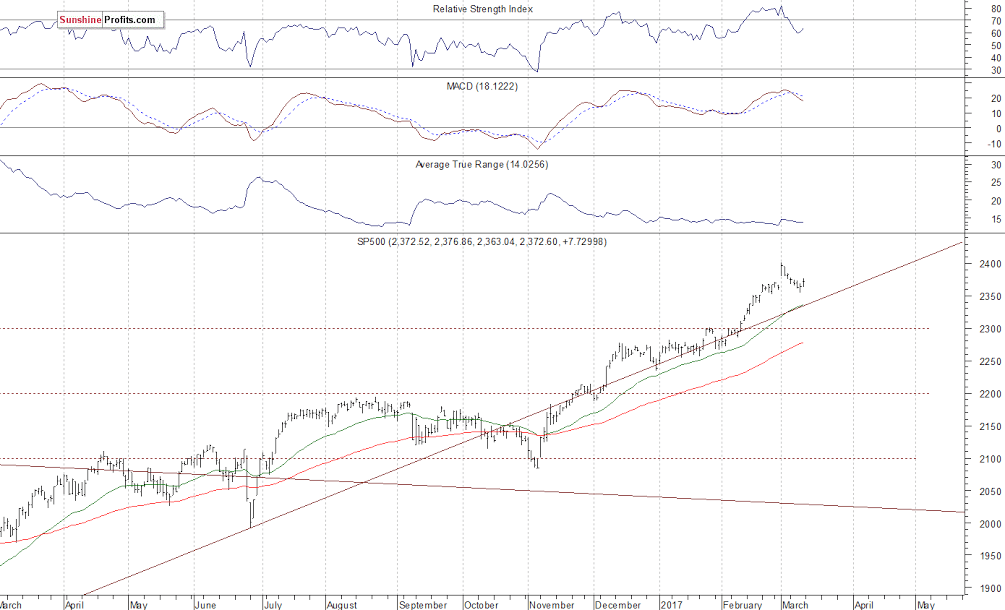
The main U.S. stock market indexes gained between 0.2% and 0.4% on Friday, retracing some of their recent move down, as investors reacted to better-than-expected monthly jobs data release, among others. The S&P 500 index has bounced off support level of 2,350 on Thursday. The broad stock market index remains relatively close to its all-time high of 2,400.98. The Dow Jones Industrial Average closed slightly above 20,900 mark on Friday, and the technology Nasdaq Composite index got closer to the level of 5,900 again. All three major stock market indexes continue to trade relatively close to their early March new record highs. The nearest important level of support of the S&P 500 index is at around 2,350-2,360, marked by previous short-term consolidation and the February 21 daily gap up of 2,351.16-2,354.91. The support level is also at around 2,320. On the other hand, the nearest important level of resistance is at around 2,380, marked by some short-term local highs, and the next resistance level is at 2,390-2,400, marked by all-time high. Will the market extend its year-long medium-term uptrend even further before some more meaningful downward correction? We can see some short-term volatility following four-month-long rally off last year's November low at around 2,100. Is this a topping pattern before downward reversal? The uptrend accelerated on Wednesday, March 1 and it looked like a blow-off top pattern accompanied by some buying frenzy. The S&P 500 index continues to trade above its over year-long medium-term upward trend line, as we can see on the daily chart:
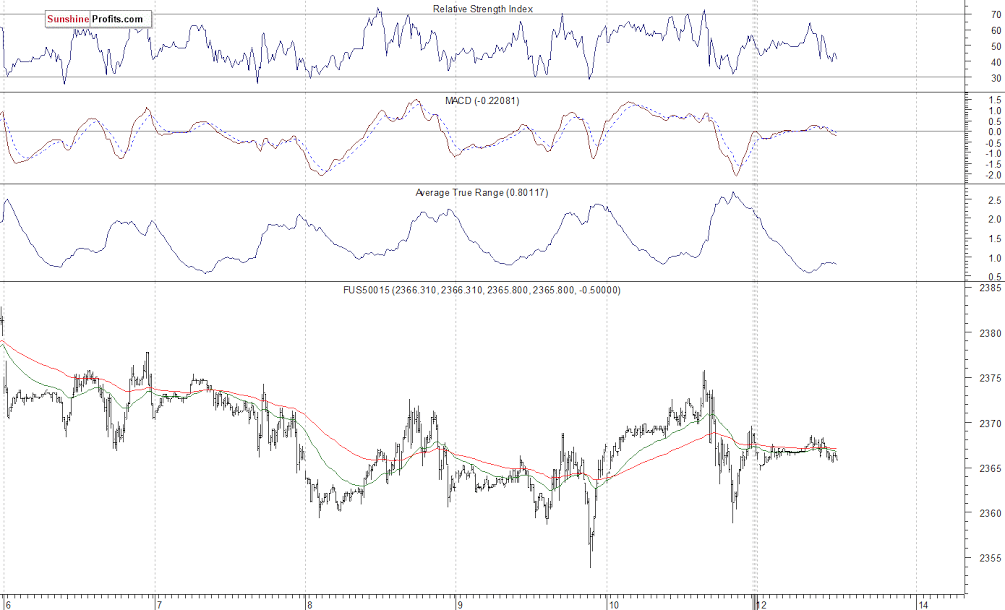
Expectations before the opening of today's trading session are virtually flat, with index futures currently between -0.05% and 0.0%. The European stock market indexes have gained 0.1-0.2% so far. Investors will wait for Tomorrow's and Wednesday's economic data releases - consumer and producer inflation numbers, FOMC Interest Rate Decision. The S&P 500 futures contract trades within an intraday consolidation, as it fluctuates following its late last week's rebound off support level. The nearest important level of resistance is at around 2,370-2,375, marked by short-term local highs. The next resistance level is at 2,390-2,400, marked by record high. On the other hand, level of support remains at 2,350-2,360, marked by short-term local lows, among others. The market continues to trade within a short-term consolidation following recent rally. There have been no confirmed negative signals so far. For now, it looks like relatively flat correction within an uptrend:
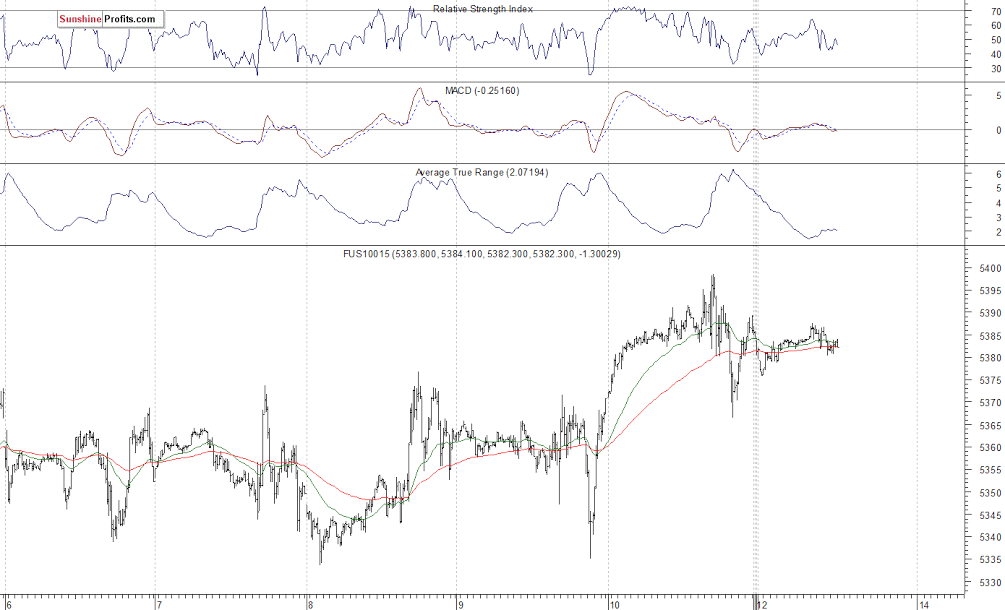
The technology Nasdaq 100 futures contract is relatively stronger than the broad stock market, as it currently trades close to record high at around 5,400 mark. It remains within an intraday consolidation following Friday's advance. The market has bounced off support level of 5,330-5,340 on Thursday. The nearest important level of resistance is at 5,400, marked by all-time high. On the other hand, support level is at 5,370, marked by recent fluctuations, as the 15-minute chart shows:
Concluding, the broad stock market retraced some of its recent decline on Friday, as the S&P 500 continued its Thursday's rebound. Expectations before the opening of today's trading session are virtually flat, following Friday's better-than-expected monthly jobs data release. Will the market resume its uptrend? There have been no confirmed negative signals so far. However, we still can see medium-term overbought conditions accompanied by negative technical divergences. Therefore, we continue to maintain our speculative short position (opened on Wednesday, February 15 at 2,335.58 - opening price of the S&P 500 index). Stop-loss level is at 2,410 and potential profit target is at 2,200 (S&P 500 index). You can trade S&P 500 index using futures contracts (S&P 500 futures contract - SP, E-mini S&P 500 futures contract - ES) or an ETF like the SPDR S&P 500 ETF - SPY. It is always important to set some exit price level in case some events cause the price to move in the unlikely direction. Having safety measures in place helps limit potential losses while letting the gains grow.
To summarize: short position in S&P 500 index is justified from the risk/reward perspective with the following entry prices, stop-loss orders and profit target price levels:
S&P 500 index - short position: profit target level: 2,200; stop-loss level: 2,410
S&P 500 futures contract (March) - short position: profit target level: 2,197; stop-loss level: 2,407
SPY ETF (SPDR S&P 500, not leveraged) - short position: profit target level: $220; stop-loss level: $241
SDS ETF (ProShares UltraShort S&P500, leveraged: -2x) - long position: profit target level: $15.47; stop-loss level: $12.98
Want free follow-ups to the above article and details not available to 99%+ investors? Sign up to our free newsletter today!
Author

Paul Rejczak
Sunshine Profits
Paul Rejczak is a stock market strategist who has been known for the quality of his technical and fundamental analysis since the late nineties.


