New record close for Nasdaq Composite

Market Recap
|
Market Recap |
% |
Close Price |
|
NAS100(Dec.2017) |
1.19% |
6,341.00 |
|
SPX500(Dec.2017) |
0.78% |
2,585.00 |
|
USDCHF |
0.58% |
0.9941 |
|
UKOIL(Jan.2018) |
0.82% |
61.36 |
|
USDRUB |
0.87% |
59.6907 |
|
USDZAR |
1.59% |
14.1567 |
Prices as of previous day instrument closing.
- European shares bounced back from a 7-day slump, led by construction and travel firms. The weaker euro also gave stocks a lift. Euro Stoxx 50 and DAX rose 0.55%, but IBEX 35 outperformed the rest of the field, up 0.75%, followed closely by the CAC 40 at 0.66% . Risk appetite came back also on US equities as the DJIA rose 187.08 points or 0.80% to 23,458.36 while the Nasdaq Composite gained 87.08 points or 1.3% at 6,793.29. Nasdaq Composite made a record close after an intraday all time high at 6,806.67. Nasdaq100 closed 5 points below its record close.
- Analysts are calling for a strong performing 2018 for European stocks, as they had consistently underperformed compared to their US and Asian counterparts. Investor confidence is cautious, despite earnings recovering and profits recording a sixth straight positive quarter.
- In the FX market EURUSD slid for the second consecutive session to 1.1770 , down -0.17%. GBPUSD rose to 1.13195, up +0.1822% while USDJPY rose to 113.06, with a +0.15% gain.
- Silver outperformed Gold as the shiny metal closed almost flat at 1,278.58 $/oz while XAGUSD rose +0.53% to 17.09 $/oz.
Charts of the day:
NASDAQ COMPOSITE INDEX (daily timeframe)
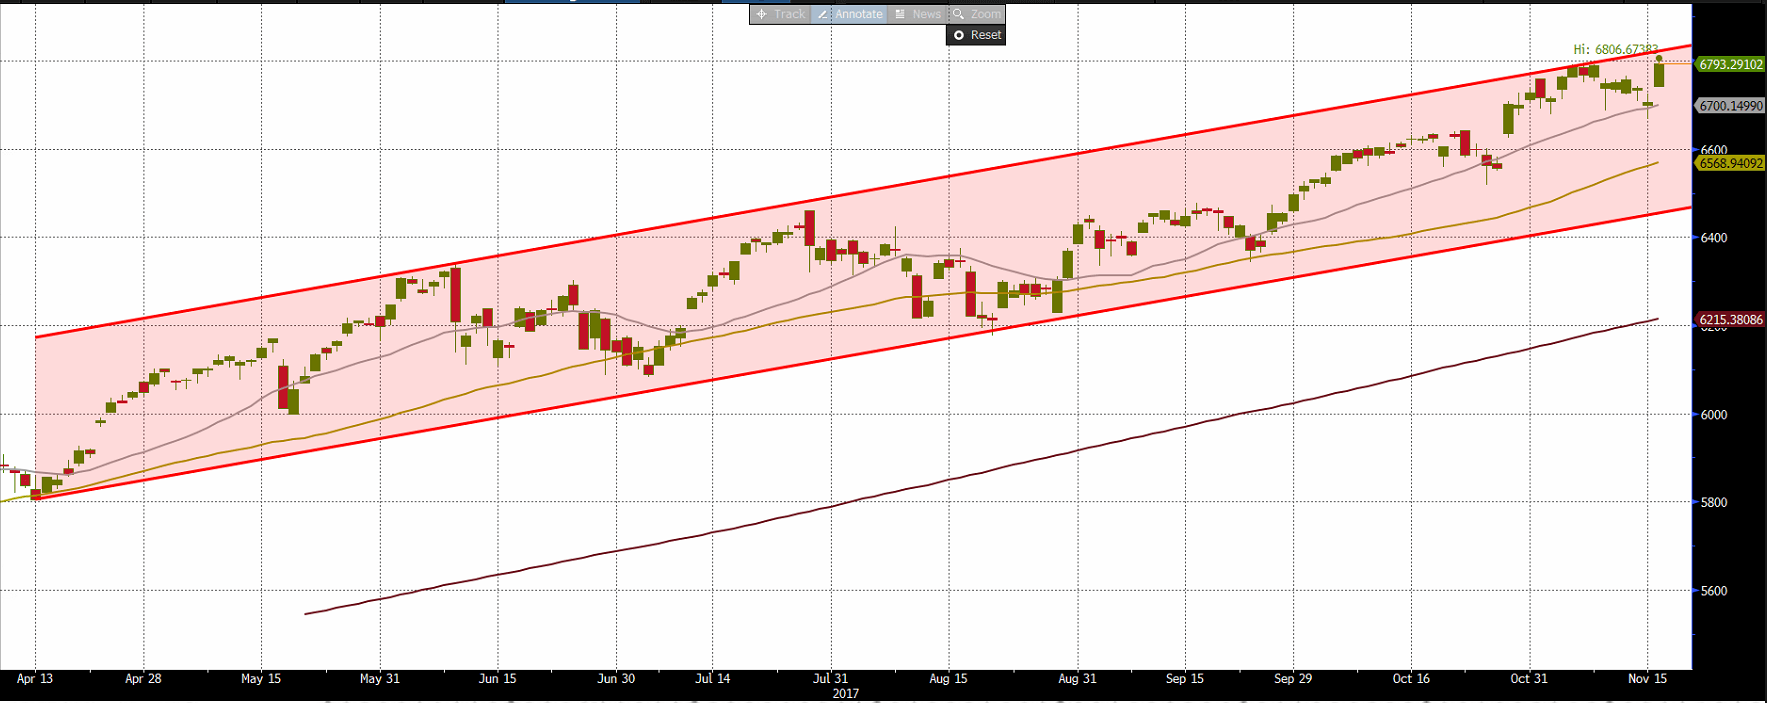
The gauge not only made a record close, but also it is on the way to reach the higher side of the bullish channel and a breakout above it should lift Nasdaq Composite to 7,000. The channel as a width of 400 points thus a breakout in area 6,900 has a price projection to 7,300. In case selling pressure will increase the gauge should test area 6,700. Below this level there are supports near area 6,570 and then the lower side of the channel.
Chicago Board Options Exchange NDX Volatility
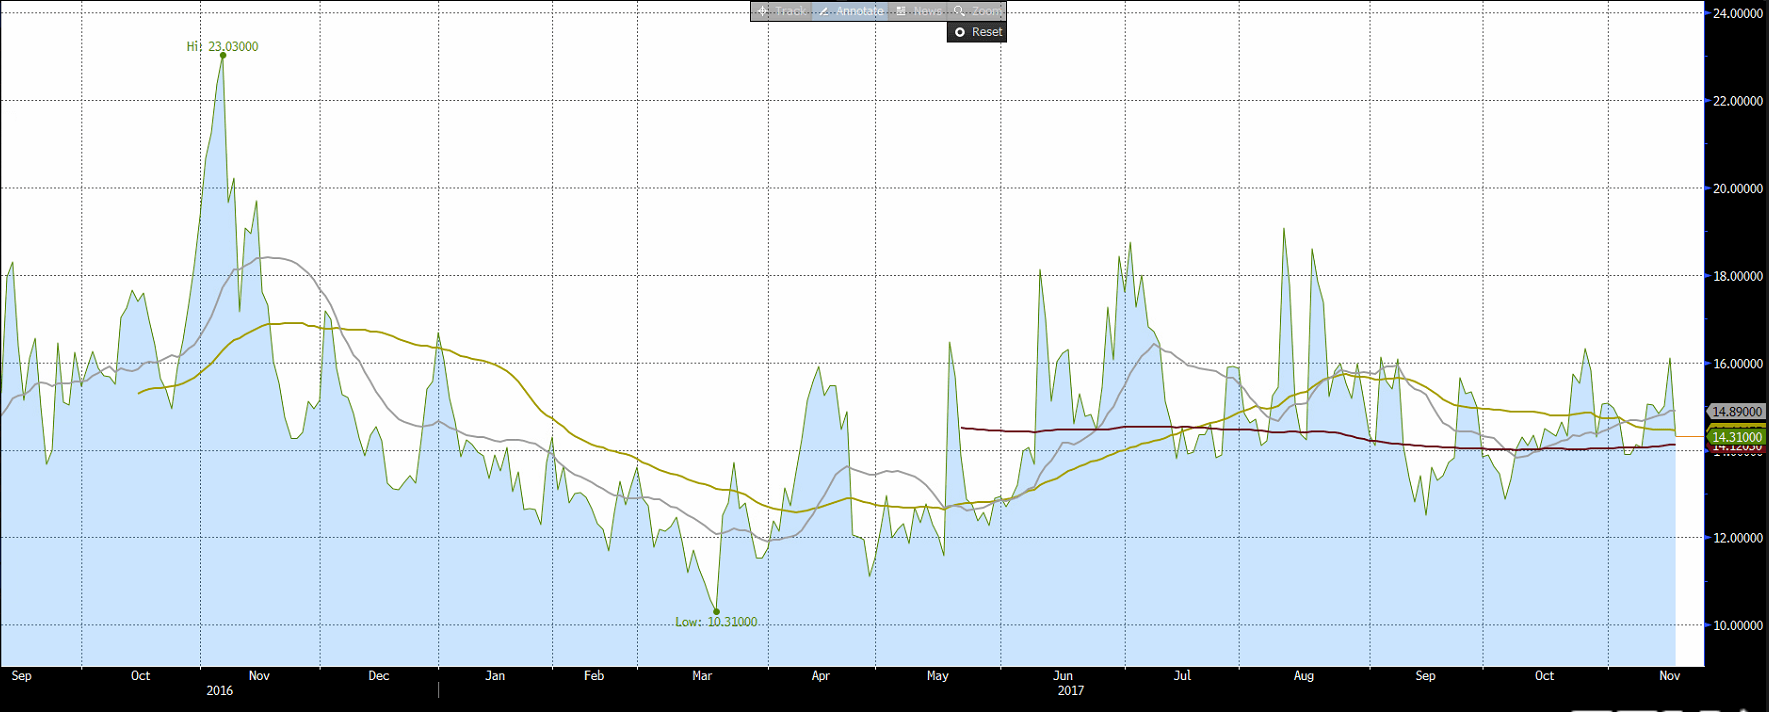
The implied volatility on Nasdaq100 options, now at 14.31, is between the 2017 range 10.31-19.06, thus in the lower part of the range but is still above its 200 day Moving average.
Economic Calendar
|
Friday November 17, 2017 CET Time |
Forecast |
Previous | ||
|
09:30 |
EUR |
ECB President Draghi Speaks | ||
|
14:00 |
EUR |
German Buba President Weidmann Speaks | ||
|
14:30 |
USD |
Building Permits (Oct) |
1250K |
1215K |
|
14:30 |
USD |
Housing Starts (Oct) |
1190K |
1127K |
|
CAD |
Core CPI (MoM) (Oct) |
0.1% |
0.2% | |
The week ends with data from across the Atlantic and the Frankfurt European Banking Congress. At the congress titled “Europe into a New Era: How to Seize the Opportunities”, Draghi will be speaking at 9:30 and Weidmann at 14:00. As always, attention should be paid to subtle clues for the future of the ECB’s monetary policy. Canadian core CPI is expected to rise 0.1% month-over-month from 0.2% in September. The YoY figure is expected to increase 1.4% from 1.6%. US housing starts are likely to rebound as hurricane disruptions in the data have declined. They are forecasted to rise 1190K, up from 1127K. Building permits are estimated at 1250K, up from 1215K.
Technical Analysis
EURUSD (Daily timeframe)
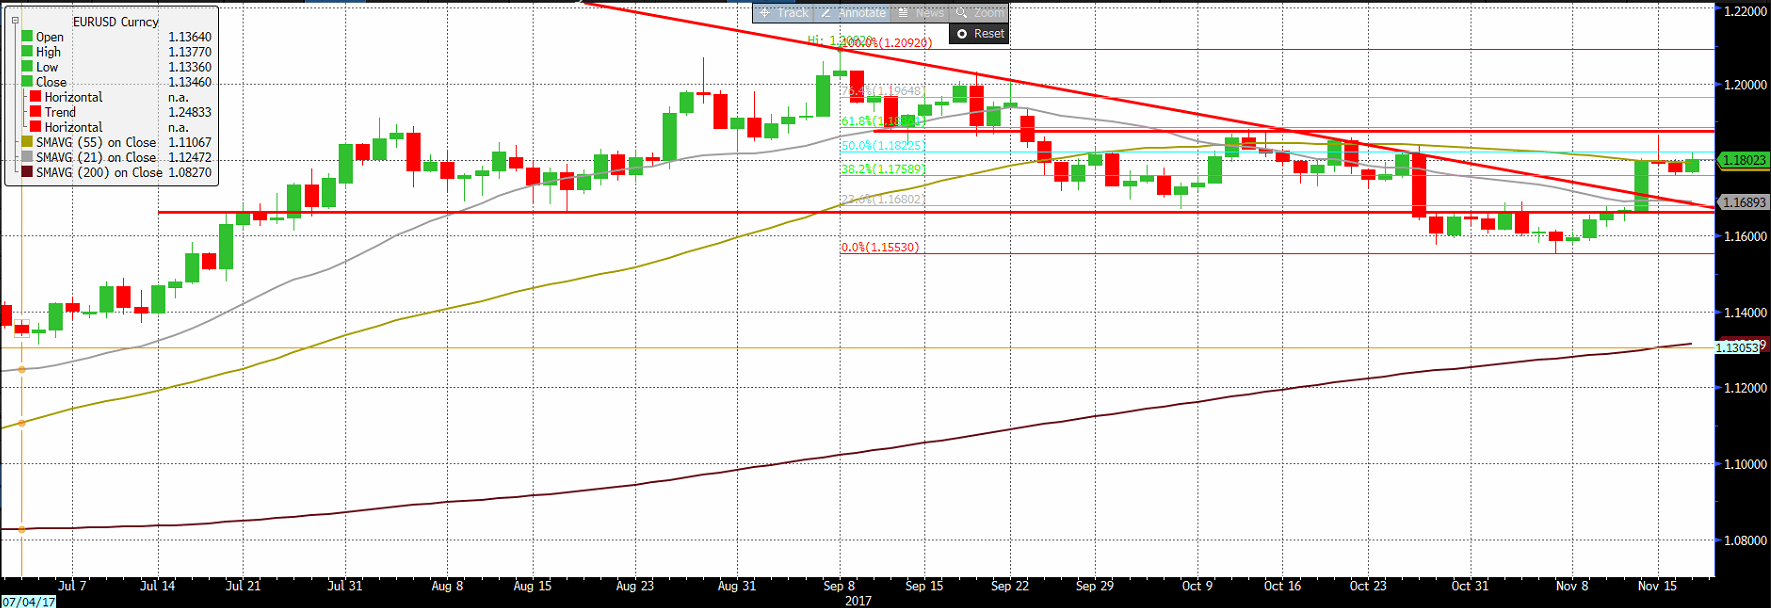
EURUSD could test soon Wednesday top, that is also the 61.8% retracement of the bearish wave that started from its 2017 top 1.2092. Above 1.1886 the pair could rise to 1.20. If EURUSD should drop near 1.1640 it may test again 1.1553, its November low.
USDJPY (Daily timeframe)
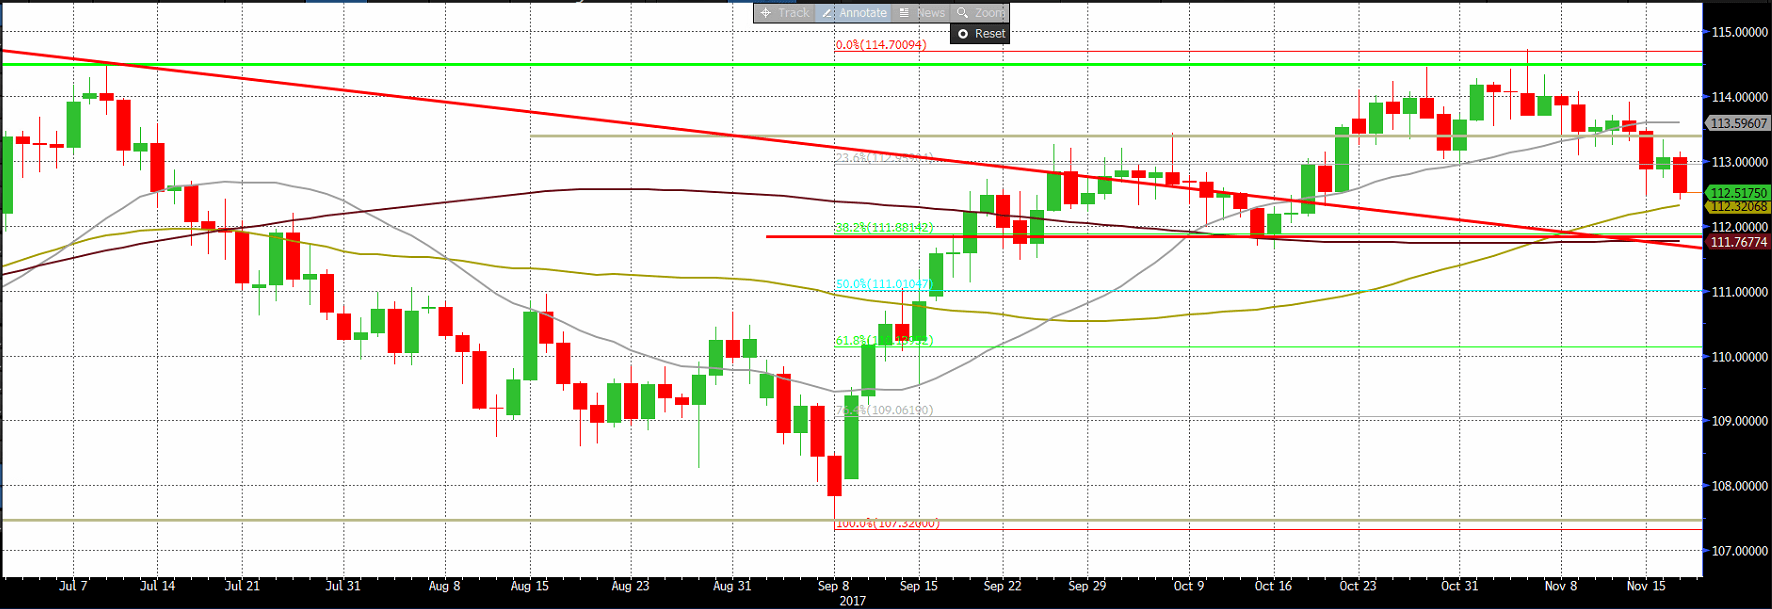
The pair slid to its 55 MA support near 112.32. Below this dynamic support the pair could slide to area 112 and beneath this level USDJPY could reach the 61.8% retracement near 100. Above 113.60 the pair could rise to its static resistance 114.7.
EURO STOXX50 (Daily timeframe)
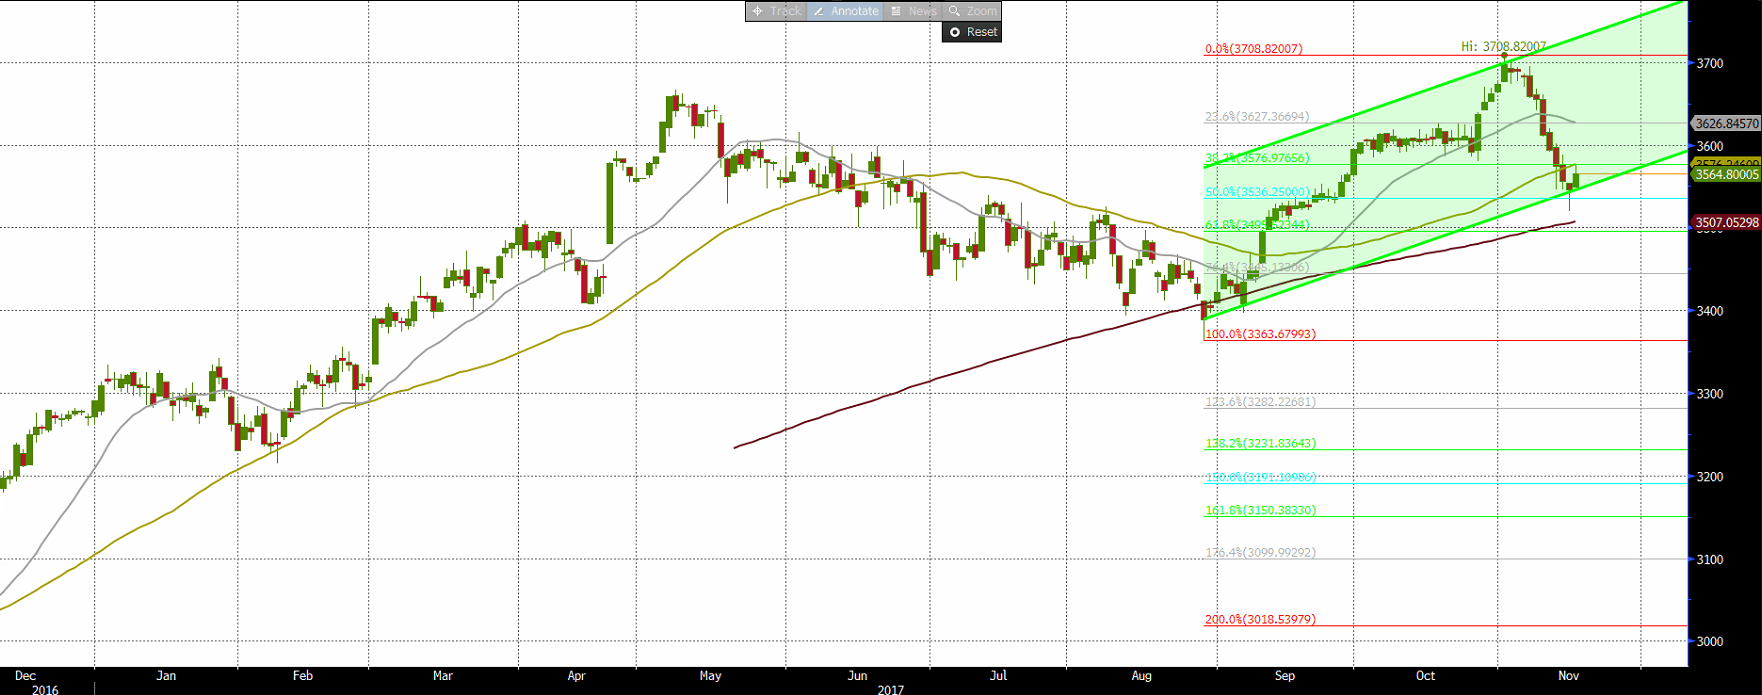
EURO STOXX 50 rallied higher, after bouncing on the 50% Fibonacci retracement of the August low to November high move. The day’s high at 3576 will be a pivotal intraday resistance level to determine if the European index will resume its rise. A move above 3600 should set the stage for more strength going into the end of year.
CAC40 (Daily timeframe)
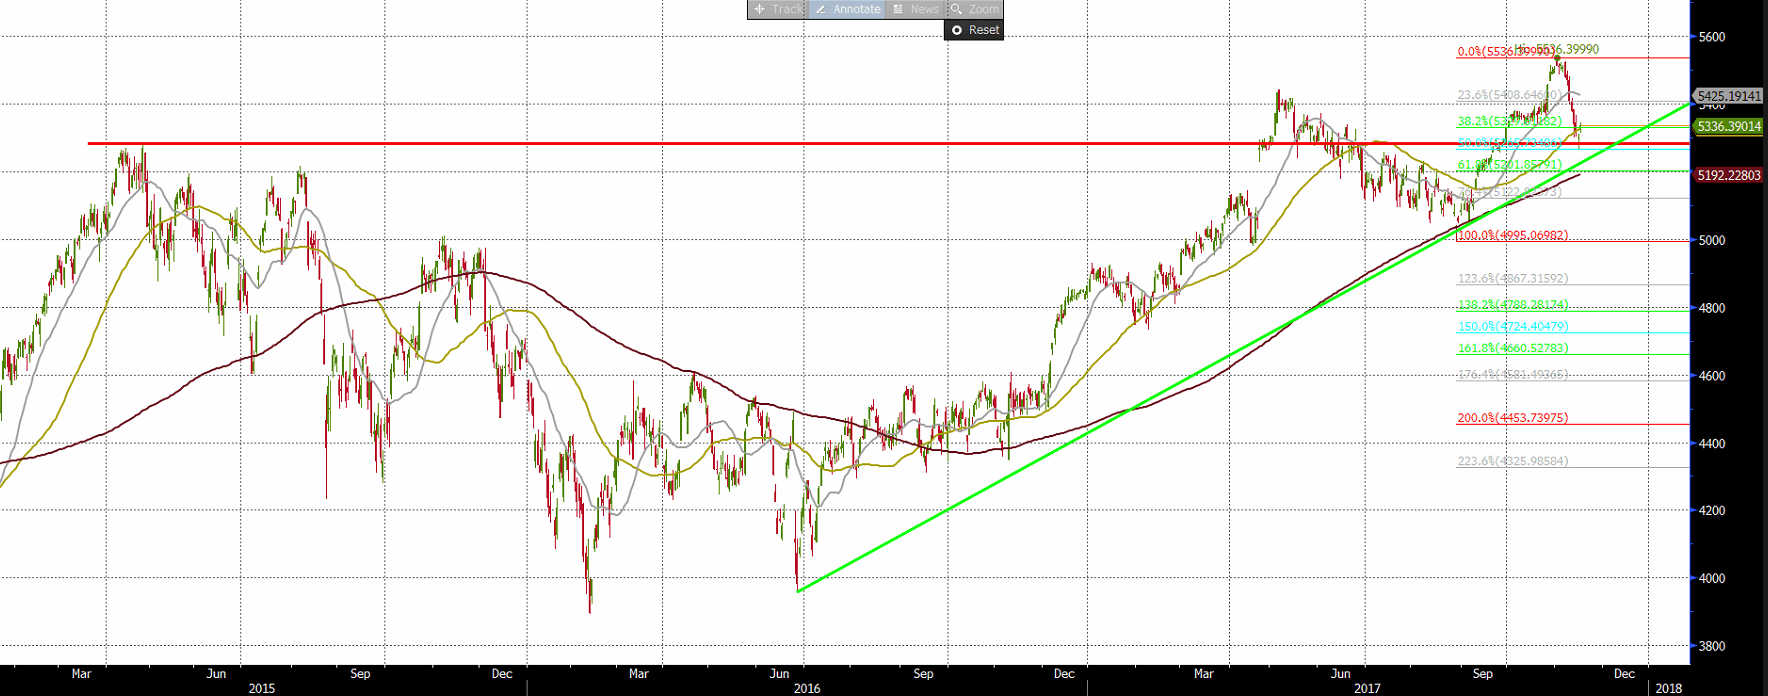
CAC40 is at a key junction. The equity index is sitting on an important support level represented by a multi-year peak from April 2015, which could hold it retracing further from its recent highs. The level at 5265 also represents the 50% Fibonacci retracement of the 2017 low to high move. Since bouncing off this key support, the index has rallied almost 100 points and was among the best performing indices. To the upside, it should meet resistance in the 5381/5400 level.
FTSEMIB (Daily timeframe)
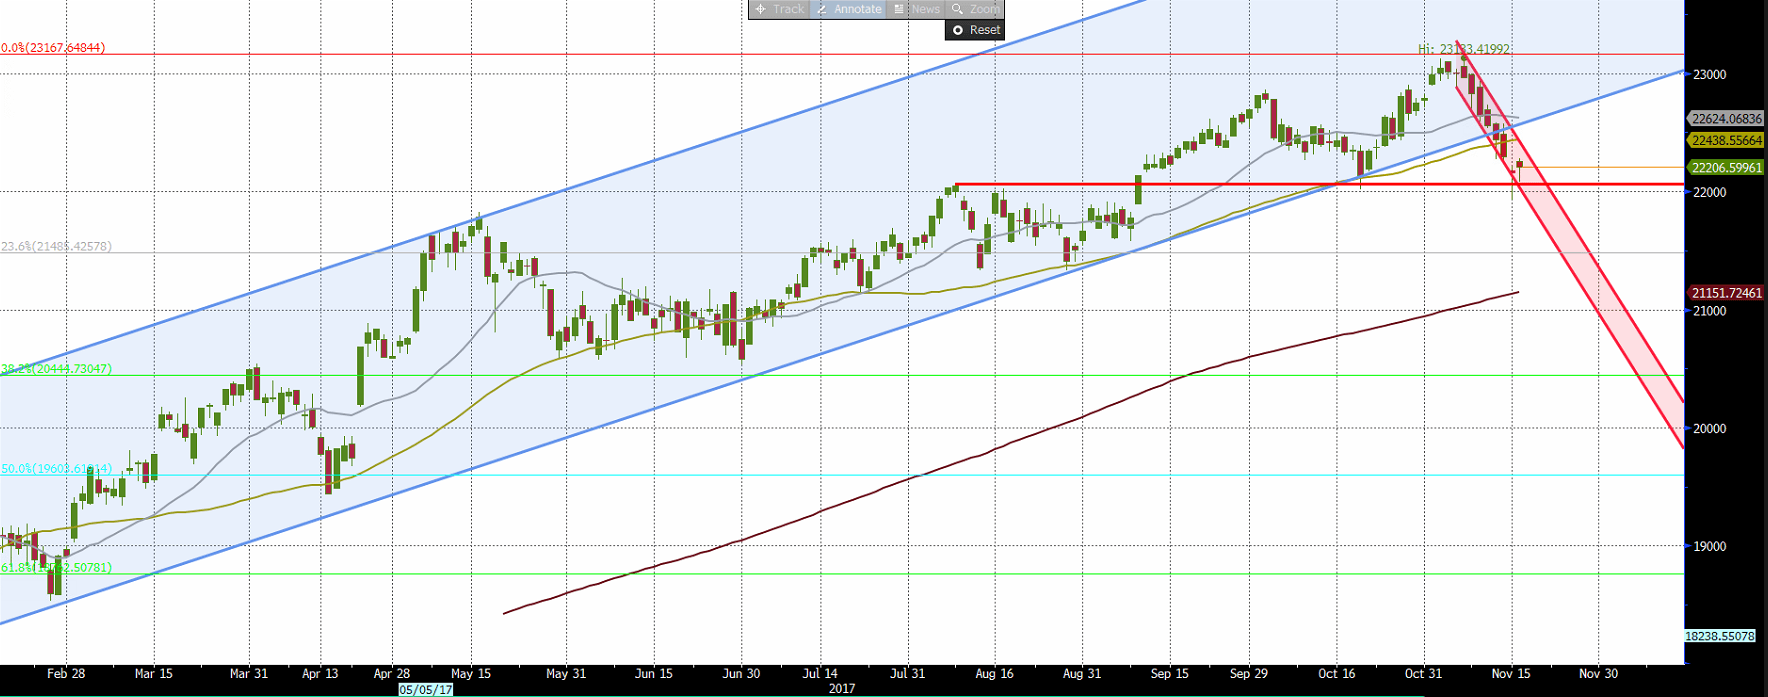
FTSEMIB closed managed to close higher than yesterday’s close, snapping a 9-day losing streak. The equity index bounced off a key horizontal support for the near-term, and another positive day tomorrow could relieve it from some bearish pressure. To the upside, intraday resistance is present at 22297, the gap between Tuesday’s close and Wednesday’s open. A break below 22000 could pave the way for more weakness to 21500.
Author

ALB Team
ALB Forex Trading
ALB Research Department is the research department of ALB Forex Trading Ltd.


