New highs during the London session
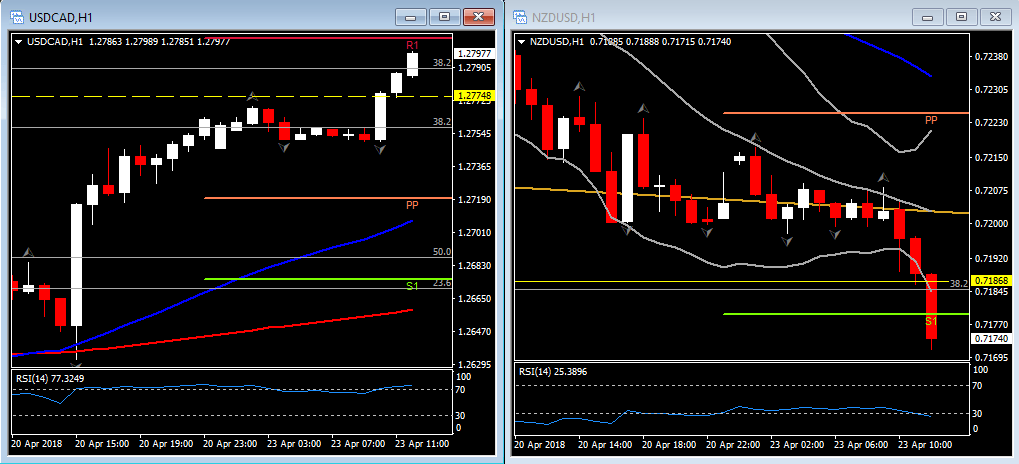
NZDUSD & USDCAD, H1
The dollar has rallied during the London morning session, presently near highs and showing a 0.4% gain on the euro, a 0.3% advance versus the yen and Swiss franc, and 0.4% gains versus both the Australian and New Zealand dollars. The greenback has firmed versus the sterling and Canadian dollar, albeit by a relatively more modest extents.
USDCAD just clocked in a fresh two-week high at 1.27898, extending a rebound from a two-month low at 1.2527, which was seen last Wednesday. A correction in oil prices, which have descended to back near $68.0 in the WTI benchmark market after making a 40-month high at $69.56, along with a generally firmer bias in the U.S. dollar, have driven the rebound in USDCAD. The Canadian dollar had already been coming off the boil in the wake of last Wednesday’s BoC policy meeting, as the statement indicated that the central bank would maintain its cautious stance on future policy changes, which remain data dependent. The latest price action in USDCAD has negated the downside trend that had been in play over the prior three weeks, from levels near 1.3100. Technically-wise, the strong uptrend could be confirmed also from the strong bullish signs out of RSI and MACD indicator and the extension of the upper Bollinger Bandin the intra-day charts. Meanwhile the pair is traded withing the upper Bollinger bands pattern since Friday.
Hence with the USDCAD breaking above the 38.2% Fibonacci level from the 2-months low, the Bullish trend remains as the strongest scenario short and long term. The next immediate resistance for the day comes at 50% Fib Level, at 1.2830, and at the confluence of Daily up fractal and R2 from PP analysis, at 1.2850.
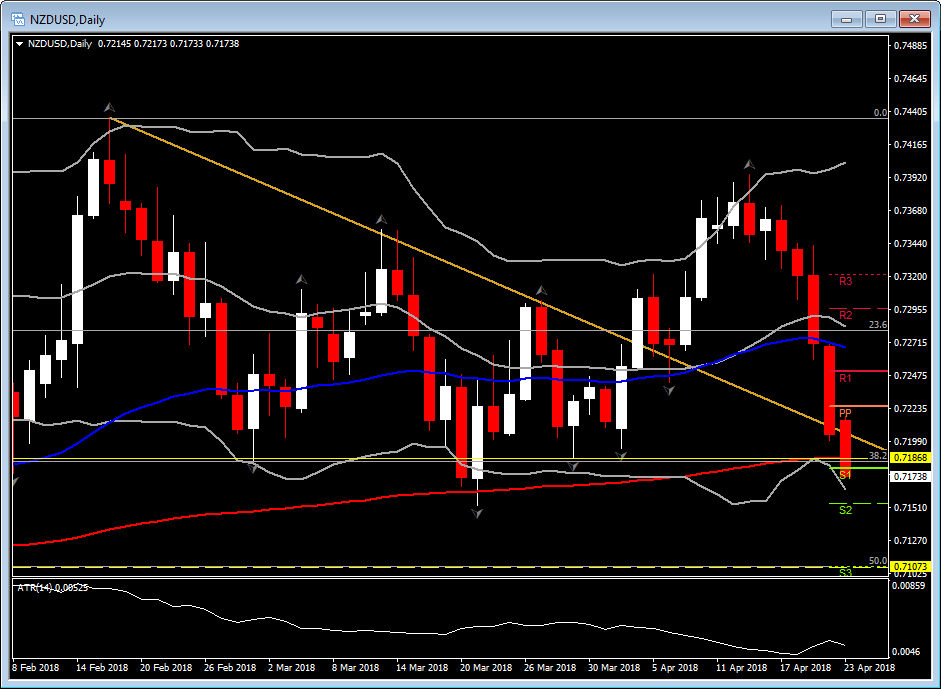
Nevertheless, despite Canadian dollar, another commodity currency has been seen facing major losses again US Dollar today. The NZDUSD has been seen breaking in the last hourly session the significant 0.7185 level. The latter was a strong support level of the pair during 2018, but also is the confluence of the significant 200-DAY EMA and the 38.2% Fibonacci retracement level from last November’s low, down to 0.6779. This breakout along with the negative technical picture for the pair, triggered short entries, with targets at S2: 0.7150 and at the 50% Fibonacci level at 0.7107.
The pair does not give oversold signs yet, since RSI in the hourly chart and Daily chart remain close to 30, while the full bearish body hourly candles, suggest that downtrend has not ran out of steam.
There's more! Access all our latest analyses and other great content by subscribing to the HotForex Youtube channel. You can also talk to our experts live by registering for one of our free webinars!
Author

Having completed her five-year-long studies in the UK, Andria Pichidi has been awarded a BSc in Mathematics and Physics from the University of Bath and a MSc degree in Mathematics, while she holds a postgraduate diploma (PGdip) in


