Neutral Bias = Neutral Day

As of this writing 4:20 AM EST, here’s what we see:
US Dollar: Sept. USD is Down at 92.095.
Energies: Oct Crude is Down at 49.46.
Financials: The Dec 30 year bond is Up 9 ticks and trading at 155.08.
Indices: The Dec S&P 500 emini ES contract is 12 ticks Lower and trading at 2491.25.
Gold: The Dec gold contract is trading Up at 1330.90. Gold is 16 ticks Higher than its close.
Initial Conclusion
This is not a correlated market. The dollar is Down- and Crude is Down- which is not normal but the 30 year Bond is trading Higher. The Financials should always correlate with the US dollar such that if the dollar is lower then bonds should follow and vice-versa. The indices are Down- and Crude is trading Down- which is not correlated. Gold is trading Up+ which is correlated with the US dollar trading Down-. I tend to believe that Gold has an inverse relationship with the US Dollar as when the US Dollar is down, Gold tends to rise in value and vice-versa. Think of it as a seesaw, when one is up the other should be down. I point this out to you to make you aware that when we don’t have a correlated market, it means something is wrong. As traders you need to be aware of this and proceed with your eyes wide open.
At this hour Asia is trading mainly Lower with the exception of the Nikkei exchange which is higher. As of this writing all of Europe is trading Lower.
Possible Challenges To Traders Today
-
Core Retail Sales is out at 8:30 AM EST. This is major
-
Retail Sales is out at 8:30 AM EST. This is major.
-
Empire State Mfg Index is out at 8:30 AM. This is major.
-
Capacity Utilization Rate is out at 9:15 AM. This is major.
-
Industrial Production m/m is out at 9:15 AM. This is major.
-
Prelim UoM Consumer Sentiment is out at 10 AM, This is major.
-
Prelim UoM Inflation Expectations is out at 10 AM. This is major.
-
Business Inventories is out at 10 AM. This is not major.
Treasuries
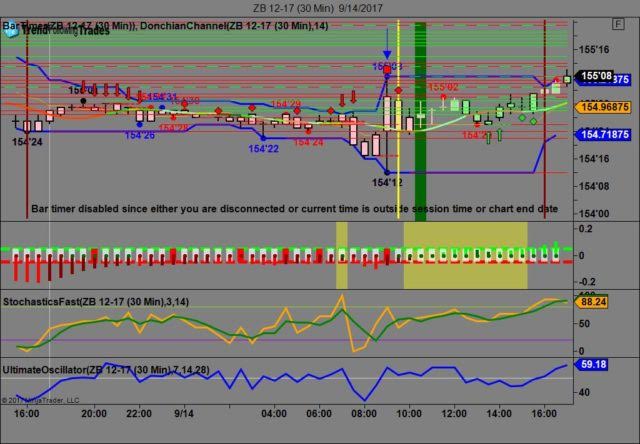
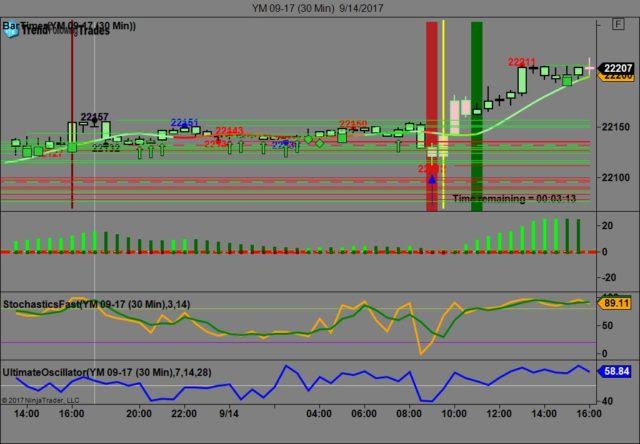
We’ve elected to switch gears a bit and show correlation between the 30 year bond (ZB) and The YM futures contract. The YM contract is the DJIA and the purpose is to show reverse correlation between the two instruments. Remember it’s liken to a seesaw, when up goes up the other should go down and vice versa.
Yesterday the ZB made it’s move at around 9 AM EST with most of the economic news reported. The ZB hit a High at around that time and the YM hit a Low. If you look at the charts below ZB gave a signal at around 9 AM EST and the YM was moving Higher at the same time. Look at the charts below and you’ll see a pattern for both assets. ZB hit a High at around 9 AM and the YM hit a Low. These charts represent the newest version of Trend Following Trades and I’ve changed the timeframe to a 30 minute chart to display better. This represented a shorting opportunity on the 30 year bond, as a trader you could have netted about 20 plus ticks per contract on this trade. Each tick is worth $31.25. We added a Donchian Channel to the charts to show the signals more clearly. Please note that the front month for the ZB contract is now December, 2017.
Charts Courtesy of Trend Following Trades built on a NinjaTrader platform.
Bias
Yesterday we called for a Neutral bias as the indices didn’t seem to have any sense of direction yesterday morning. The S&P and Nasdaq both traded lower yesterday but the Dow traded higher by 45 points. All in all a neutral or mixed day. Today we aren’t dealing with a correlated market but will maintain a neutral bias.
Could this change? Of Course. Remember anything can happen in a volatile market.
Commentary
Yesterday the economic news reported seemed to bolster an upside move as Unemployment Claims came in far less than expected (284K versus 303K expected). Core CPI met expectation. The markets were poised to go lower yesterday morning but the good news kept the markets at bay. Today we have 8 economic reports, most of which are major so we’ll have to monitor how the markets react to it.
Just so you understand, Market Correlation is Market Direction. It attempts to determine the market direction for that day and it does so by using a unique set of tool.
Author

Nick Mastrandrea
Market Tea Leaves


