Neutral Bias = A Mixed Day

Good Morning Traders,
As of this writing 4:10 AM EST, here’s what we see:
US Dollar: Sept. USD is Up at 95.135.
Energies: Sept '18 Crude is Down at 66.65.
Financials: The Sept 30 year bond is Up 9 ticks and trading at 142.28.
Indices: The Sept S&P 500 emini ES contract is 1 ticks Lower and trading at 2855.00.
Gold: The Aug gold contract is trading Down at 1219.50 Gold is 15 ticks Lower than its close.
Initial Conclusion
This is not a correlated market. The dollar is Up+ and Crude is Down- which is normal and the 30 year Bond is trading Higher. The Financials should always correlate with the US dollar such that if the dollar is lower then bonds should follow and vice-versa. The S&P is Lower and Crude is trading Higher which is correlated. Gold is trading Down- which is correlated with the US dollar trading Higher. I tend to believe that Gold has an inverse relationship with the US Dollar as when the US Dollar is down, Gold tends to rise in value and vice-versa. Think of it as a seesaw, when one is up the other should be down. I point this out to you to make you aware that when we don't have a correlated market, it means something is wrong. As traders you need to be aware of this and proceed with your eyes wide open.
At this hour all of Asia is trading Mixed with half the exchanges Higher and the other half Lower. At this time all of Europe is trading Lower.
Possible Challenges To Traders Today
-
Core PPI is out at 8:30 AM EST. This is major.
-
PPI is out at 8:30 AM EST. This is major.
-
Unemployment Claims is out at 8:30 AM EST. This is major.
-
Final Wholesale Inventories is out at 10 AM. This is major.
-
Natural Gas Storage is out at 10:30 AM EST. This is major.
-
30-y Bond Auction starts at 1 PM EST. This is major.
Treasuries
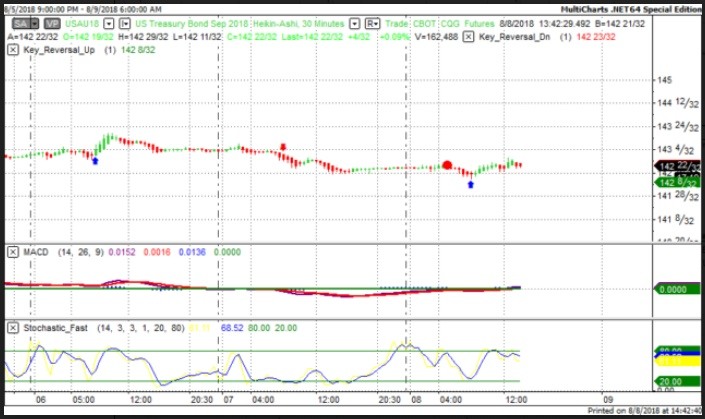
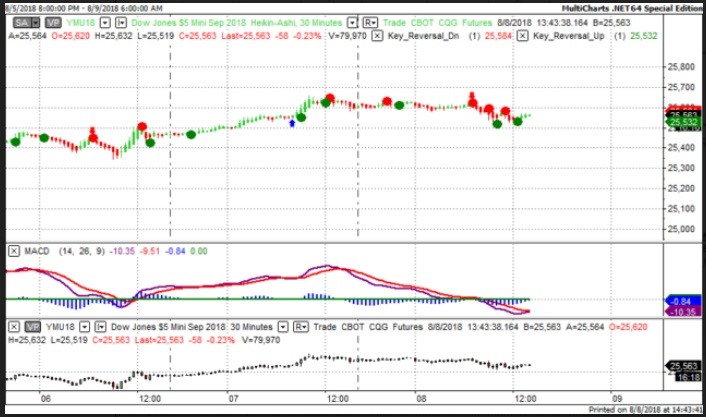
We've elected to switch gears a bit and show correlation between the 30 year bond (ZB) and The YM futures contract. The YM contract is the DJIA and the purpose is to show reverse correlation between the two instruments. Remember it's liken to a seesaw, when up goes up the other should go down and vice versa.
Yesterday the ZB made it's move at around 8 AM EST. The ZB hit a Low at around that time and the YM hit a High. If you look at the charts below ZB gave a signal at around 8 AM EST and the YM was moving Lower at the same time. Look at the charts below and you'll see a pattern for both assets. ZB hit a Low at around 8 AM and the YM was moving Lower at the same time. These charts represent the newest version of MultiCharts and I've changed the timeframe to a 30 minute chart to display better. This represented a Long opportunity on the 30 year bond, as a trader you could have netted about 15 ticks per contract on this trade. Each tick is worth $31.25.
Charts Courtesy of MultiCharts built on an AMP platform.
Bias
Yesterday we gave the markets a Neutral bias as the indices didn't seem to have any sense of direction Wednesday morning. The Dow dropped 46 points, the S&P dropped by 1 but the Nasdaq gained 5. All in all a Mixed or Neutral day. Today we aren't dealing with a correlated market and our bias is to the Downside.
Could this change? Of Course. Remember anything can happen in a volatile market.
Commentary
Yesterday we predicted a neutral market as the instruments we use to track market correlation didn't give much in the way of direction. The Dow and S&P lost ground but the NASDAQ gained. All in all a neutral or mixed day. Today we have Unemployment Claims, PPI, Core PPI; all of which are major and proven market movers. I would pay special attention to the PPI numbers as no doubt the Fed will use that as a lightening rod to determine future rate hikes. True the Fed relies on the CPI but the CPI is a derivative of the PPI. When a Producer has to pay more for raw materials or components you can bet that will show up under CPI.
Author

Nick Mastrandrea
Market Tea Leaves


