Negative risk appetite across forex majors on weaker China data

Market Overview
Risk appetite has been hit once more this morning as economic data out of China reflects the negative impact that the trade dispute with the US is having on the world’s second largest economy. Whilst China is trying to manage a soft landing in its economy as it looks to move toward a more sustainable consumer-drive services economy, the data this morning makes worrying reading. This is subsequently impacting across global financial markets. With China Industrial Production coming in well below forecasts at 5.4% (+5.9% exp, +5.9% last), and China Retail Sales with a similarly concerning miss at +8.1% (+8.8% exp, +8.6% last), the warning signs are flashing. This has had a negative impact on risk appetite today as traders move towards safer haven plays such as the Japanese yen and US Treasuries. The relative performance of the dollar is also benefiting as commodity currencies have been hit hard, whilst sterling is also pressured as it is a play with added political risk during these times of Brexit driven elevated volatility (although the EU’s hard stance with Theresa May’s floundering attempts to improve her deal have certainly not helped). Equities are also suffering this morning. Those hoping for a Santa Claus rally will need to wait just that little bit longer.

Wall Street closed mixed last night with the S&P 500 -1 tick lower at 2650, but with futures -0.8% lower today on the Chinese data overnight we have seen selling pressure through Asian markets. The Nikkei was down -2.0% whilst the Shanghai Composite was down -1.5%. European futures may not be as sharply lower but seem to be aligned to the decline on Wall Street, with FTSE 100 futures and DAX futures both around -0.8% lower. In forex, there is a safe haven bias here, with the yen outperforming, whilst the dollar is also gaining across most of the majors (aside from the yen). The Aussie and Kiwi are the most under pressure. In commodities, there is a risk averse move with silver slipping, but gold also lower (dragged by the relative dollar performance) and oil weaker by just over half a percent.
The flash PMIs will be key in the morning of the European session, with the flash Eurozone Manufacturing PMI expected to tick a shade higher to 51.9 (from the final 51.8 in November), with flash Eurozone Services PMI expected to also tick slightly higher to 53.5 (from a final 53.4 in November. The flash Eurozone Composite PMI is expected to be 52.8. Traders will also be looking out for US Retail Sales (ex-autos) at 1330GMT which are expected to growth by +0.2% (after +0.7% growth in October). The US Industrial Production for November is at 1415GMT which is expected to show +0.3% growth on the month, with Capacity Utilization looking to increase from 78.6 (from 78.4 in October).
Chart of the Day – AUD/USD
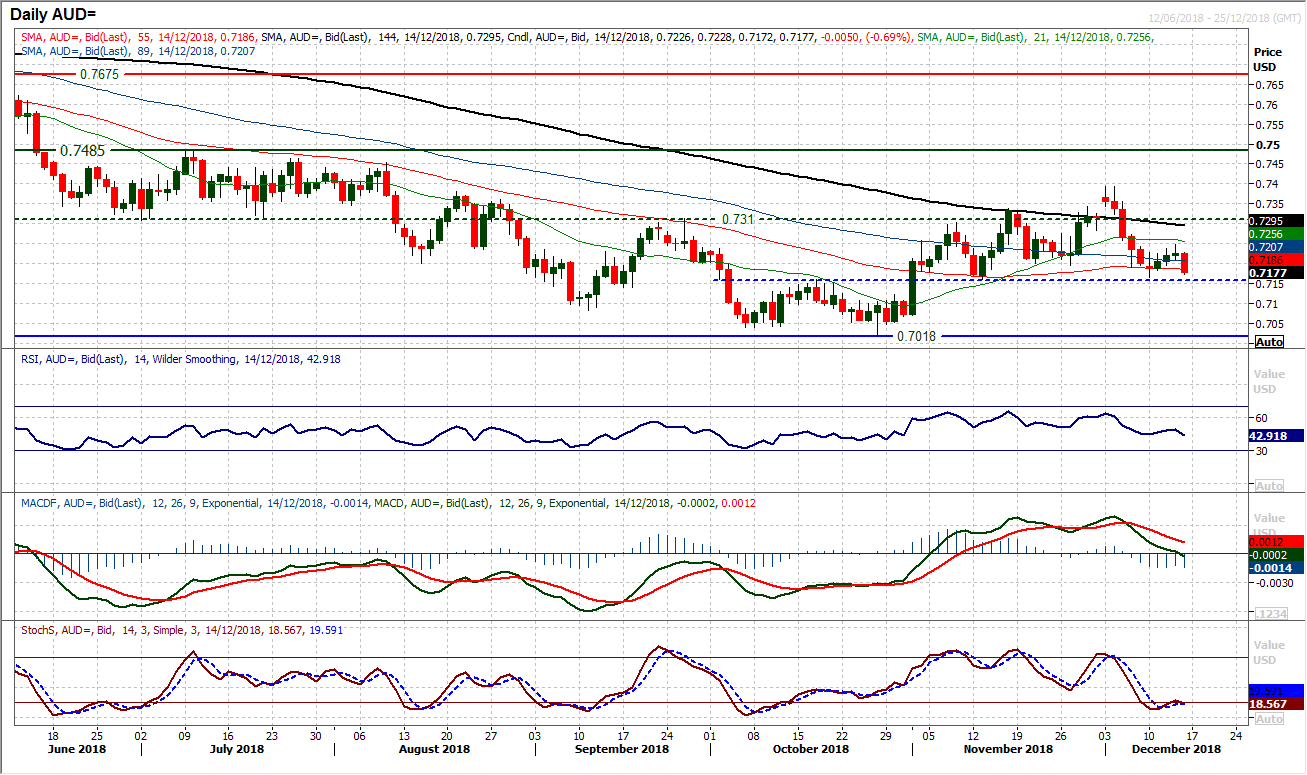
The disappointing print for Australian growth hit the Aussie hard last week, but since then a degree of support has started to form and means that there is a key floor now in place that the bulls need to hang on to if this recovery is to continue. The breakout above $0.7160 started the recovery in November and this neckline breakout once more is being seen as a key basis of support as the market has bounced in recent sessions. This will be seen as a key pivot level now as the momentum indicators have unwound to levels where the medium term bulls should be looking to regain control. The RSI is holding above 40, whilst the MACD lines are unwinding to neutral, but interestingly the Stochastics have crossed higher and are potentially set to post a buy signal. However, overnight there has been a deterioration and the hourly chart shows a trend higher of the past week has been broken. This could now put renewed pressure on the pivot at $0.7160. An interesting time with the Aussie at this crossroads.
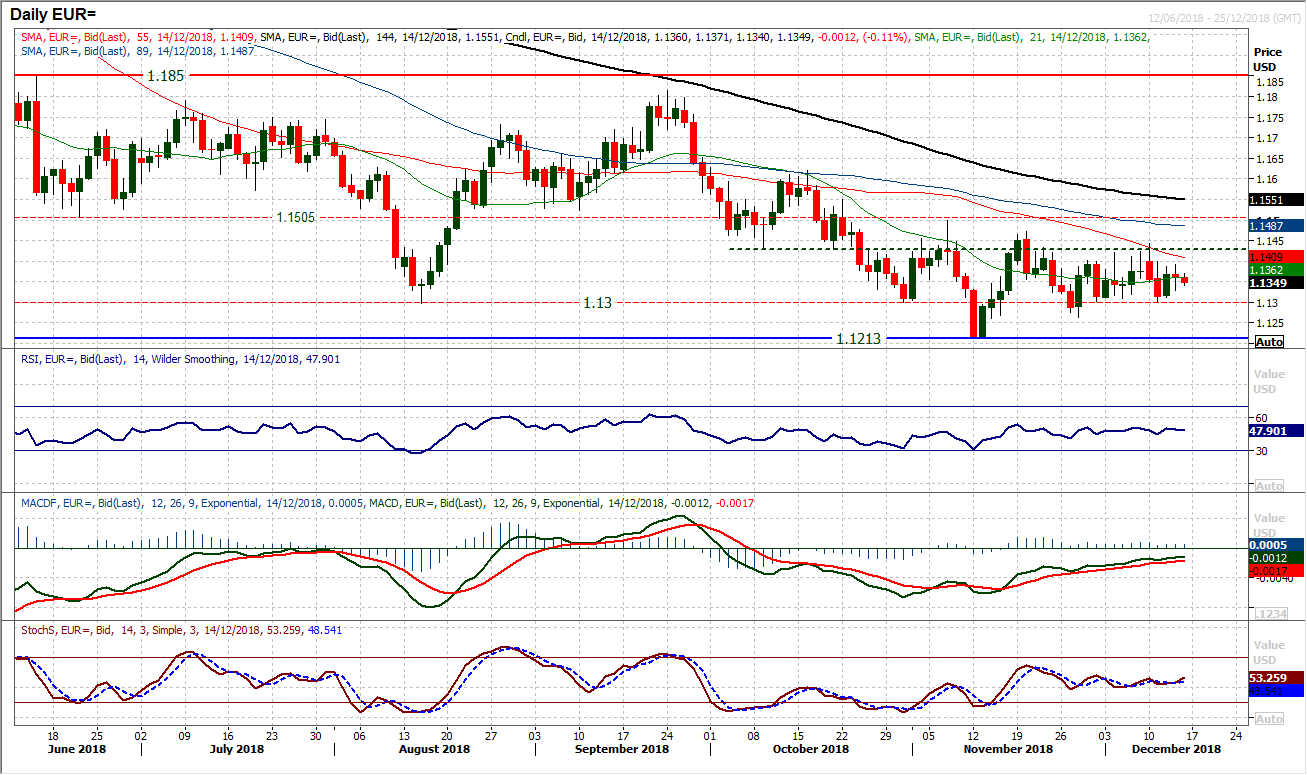
In the wake of the ECB meeting, the euro threatened lower but the move never really found the traction and subsequently a very neutral candlestick has left us with little more sign as to when or how the recent the recent consolidation will end. Support with the lows at $1.1265 and the old key support at $1.1300 seem to be holding firm, but the bulls are unable to break the shackles with resistance in the band $1.1400/$1.1445. Momentum indicators are duly neutral. There is a mild negative medium term bias still but on a nearer term basis the market is neutral. Yesterday’s almost doji candle reflects this uncertainty. The wait for direction continues.
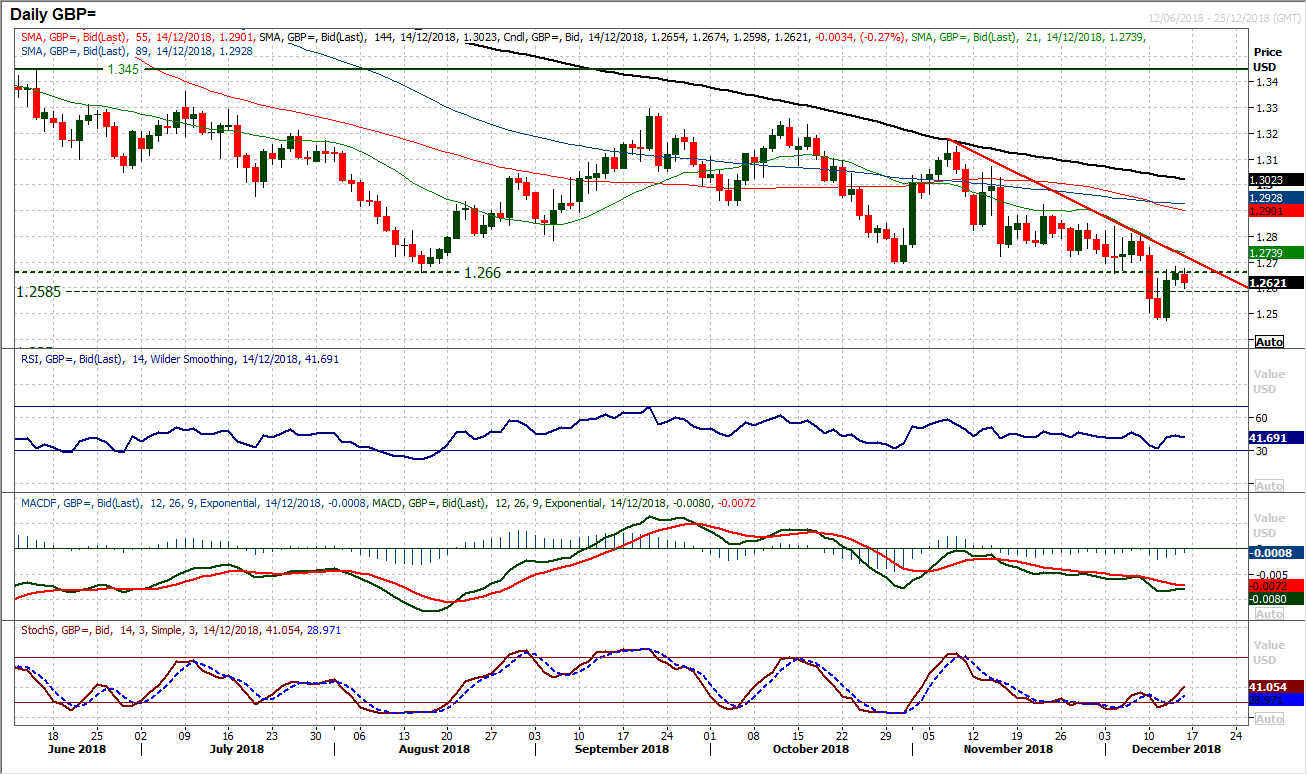
The old key floor of support at $1.2660 broke down on Monday and this has since become a basis of key resistance. There is effectively a band of overhead supply now $1.2660/$1.2720 whilst the resistance of a five week downtrend falls at $1.2725. With Brexit uncertainty still dominant for sterling, rallies continue to be seen as a chance to sell. This band of overhead supply therefore becomes a prime sell-zone now. Just like the political situation, Wednesday’s technical rally and strong bull candle does very little to change the outlook on the chart and the move has dissipated just above $1.2660. The hourly chart shows initial support at $1.2590 and if that is breached then a drift back towards the $1.2475 recent low is likely. Momentum on the daily chart shows any unwinding move helps to renew downside potential.
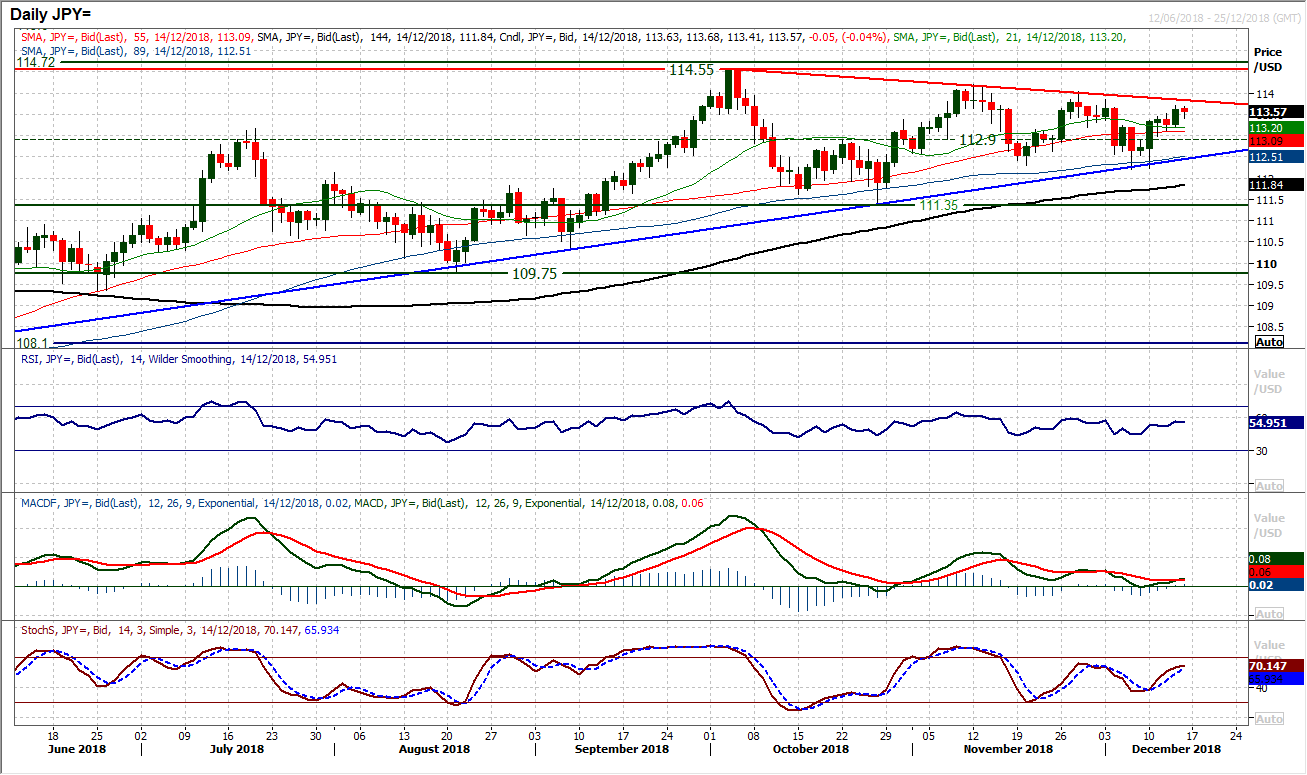
Since Monday’s sharp bullish engulfing candle seemed to edge the near term bulls back into control, the market has been drifting higher. This drift is now coming up towards the late November highs and resistance 113.85/114.00. The resistance of the nine week downtrend also comes in at 113.85 today. This morning, the move has just backed off from this resistance. Looking at the configuration of the medium term momentum indicators, the bulls are likely to find traction hard to come by. The MACD lines are reflecting a positive position but there is a lack of impetus in the bulls which would suggest the continuation of this medium term neutral market which has effectively formed a triangle consolidation. A break below initial support at 113.00/113.15 would again be a bull disappointment.
Gold
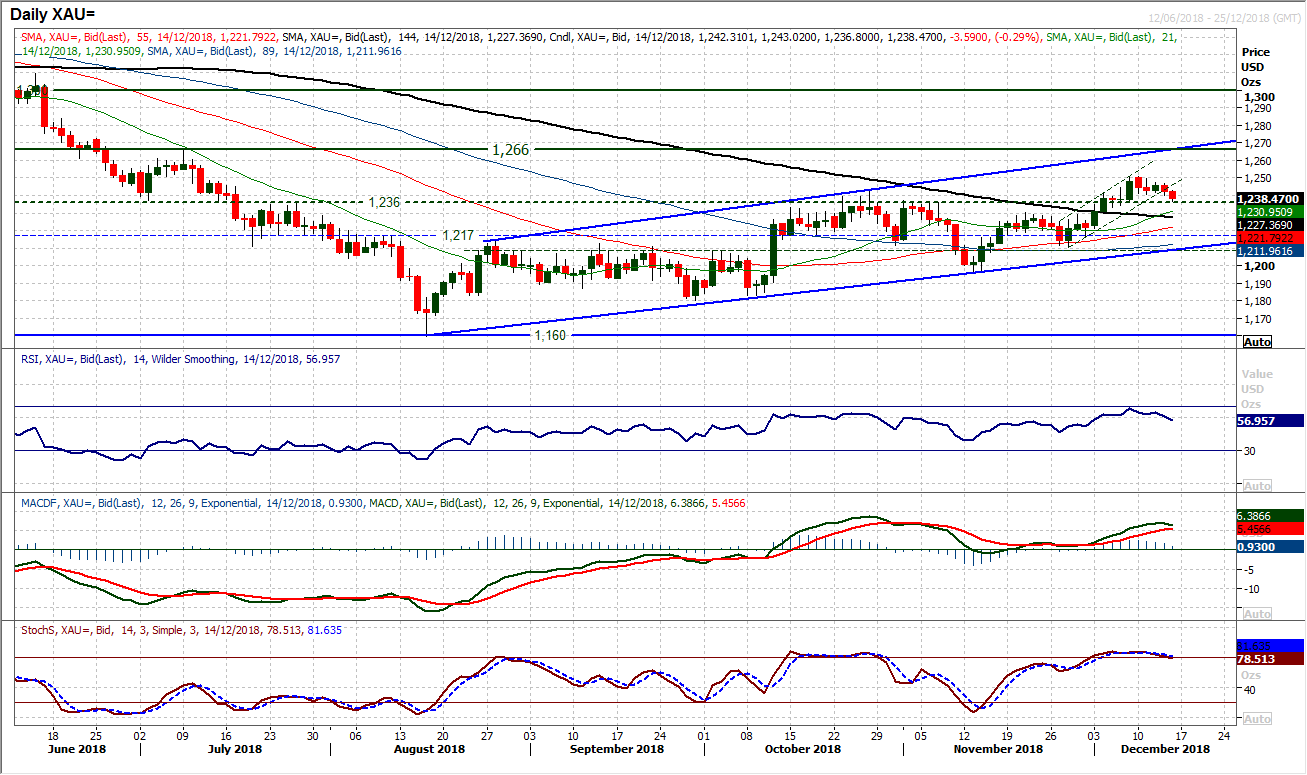
A consolidation on gold that has formed in the past few sessions that is threatening to take the wind out of the sails of the rally. There is a band of breakout support between $1236/$1243 which is beginning to become key in this move as yesterday’s mildly corrective candle could now question this support. A further drift lower early today is adding to this potential. The mini-uptrend of the past couple of weeks has now broken due to this drift back in the past week and the long term pivot at $1236 could now be tested. There is a rolling over on momentum which is now also taking hold, with the RSI drifting below 60 and Stochastics threatening a near term sell signal. The bulls would be disappointed to lose the breakout support at $1230 now as this would suggest the market is pulled back towards the channel support again (in a similar fashion to the move in October). Resistance at $1250 is mounting now, with yesterday’s high around $1247 initially a barrier.
WTI Oil
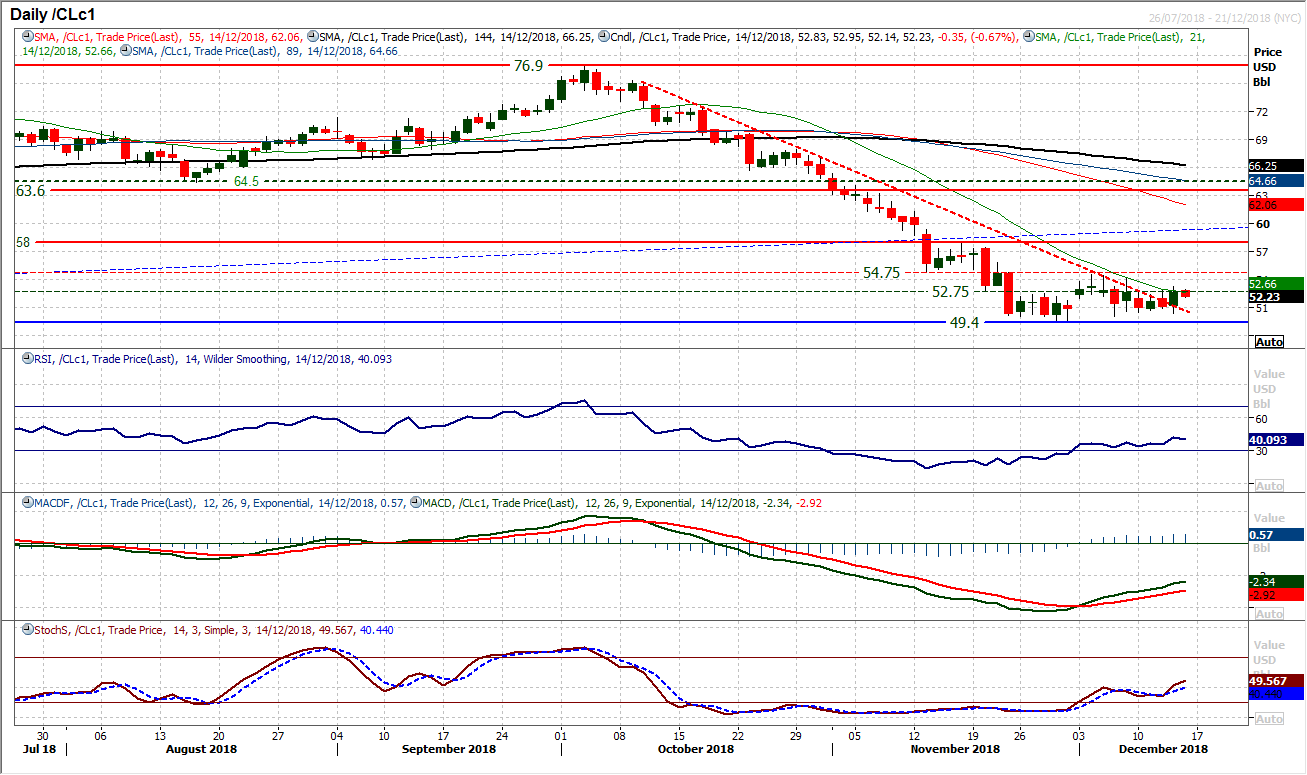
The threat of an immediate breakdown has receded on oil as the market has formed a consolidation between the low at $49.40 and resistance at $54.55 in the past few weeks. This consolidation has also now broken the nine week downtrend. After weeks of tumultuous volatility and selling pressure, the Average True range is beginning to fall away (currently $2.38, down 50c in a matter of a few days), reflecting the calming of the market as the selling pressure has significantly reduced and a range has formed. There is also a far more settled look to momentum indicators which still point to a potential unwinding of the huge medium term sell-off. However, to take off a close above resistance of the pivot at $52.75 is needed, whilst $54.75 is growing into the key medium term pivot. Support is growing in the range $50.00/$50.50.
Dow Jones Industrial Average
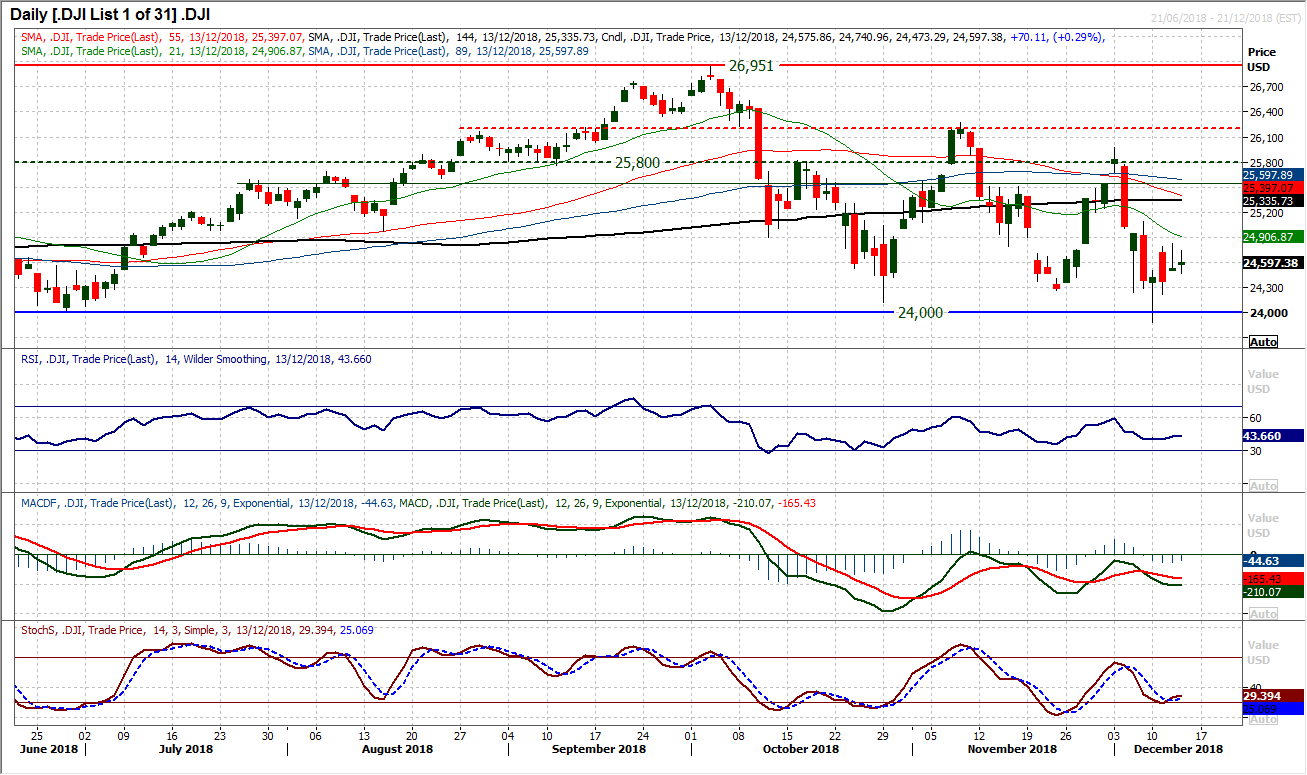
Wall Street continues to show elevated levels of intraday volatility amidst a choppy run of trading where the bulls just cannot get a grasp on a recovery. The last two sessions have been positive closes, but the candlestick analysis reflects a very uncertain recovery with the bulls lacking any real confidence. Momentum indicators have stabilised and at least the market is edging higher, but the lack of conviction in the move is a concern. The hourly chart suggests the move in the past few sessions has simply unwound oversold momentum in a move that could just have helped to renew downside potential. Resistance around 24,800 is mounting too. A move below initial support at 24,510 would begin to see the negative momentum taking hold once more. Subsequent support is 24,220 which is then back into the old key floor area 24,000/24,270.
Author

Richard Perry
Independent Analyst


