NDX outperformance noticeable; dips persuasive

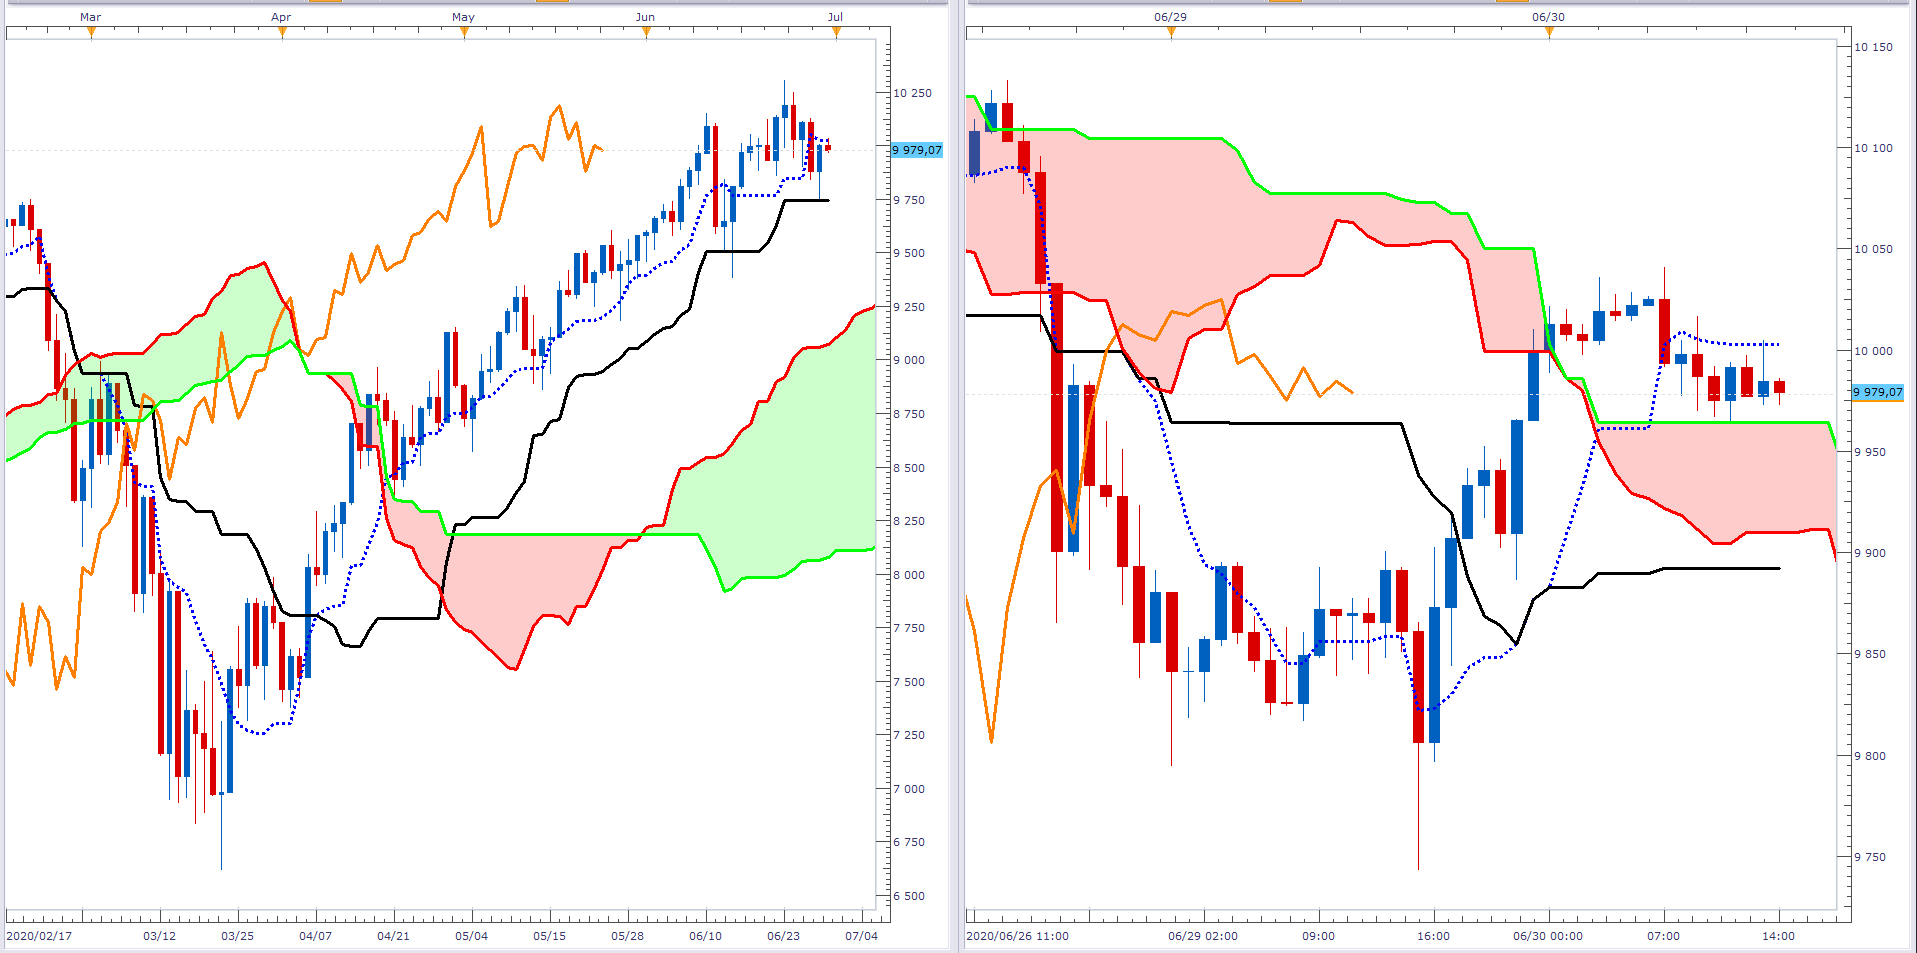
The left chart shows the daily ichimoku of the NDX. It is clear that the current trend remains up, until proven otherwise.
-
Price is above the cloud.
-
The cloud remains light green.
-
Price is above the black base line.
-
The black base line is trending up.
-
The orange lagging span is comfortably above price.
-
Yesterday’s candle is a powerful hammer bouncing off of the black base line.
-
Bullish follow though is now required to complete a higher trough.
The right chart shows the H1 ichimoku of the NDX. The index has pulled back in the shorter term.
-
Price has pushed through the cloud and is supported for now.
-
Price is above the black base line.
-
The black base line is moving up.
-
The orange lagging span is above price.
The NDX is showing relative strength compared to other mainstream benchmarks such as the SPX and RUT. This, as businesses looks to technology for solutions to promote productivity during lockdown. Moreover, the liquidity injections by central banks need to find a home and given the innovative nature of constituents, the NDX is a logical beneficiary.
Some liquidity has been siphoned out of the economy, but this is likely temporary (notably, in an opinion piece for Bloomberg, ex NY Fed Chair Bill Dudley expects the Fed’s balance sheet to head towards $10tn). As such, dips in the index are incredibly persuasive.
Past performance is not an indicator of future results
CHART SOURCE: FXCM MARKETSCOPE 2.0
Author

Russell Shor (MSTA, CFTe, MFTA) has an Honours Degree in Economics from the University of South Africa and holds the coveted Certified Financial Technician and Master of Financial Technical Analysis qualifications from the Interna


