Natural Gas Plummets to the Lowest Level Since May 2016
Natural Gas declined to $2.011 per MMBTU on Friday, being the lowest level reached by the energy commodity since May 2016, as it drops 5 cents or 2.41%, whereas, Crude Oil advances 32 cents or 0.55% ascending to $58.88 per barrel, and Brent Oil gains 30 cents or 0.47% hitting at $65.01per barrel.
As we see, the energy group moves mixed on Friday. While oils advances, Natural Gas continue declining for its fifth consecutive session, falling to $2.011 per BBTU, the lowest level since May 30th, 2016.
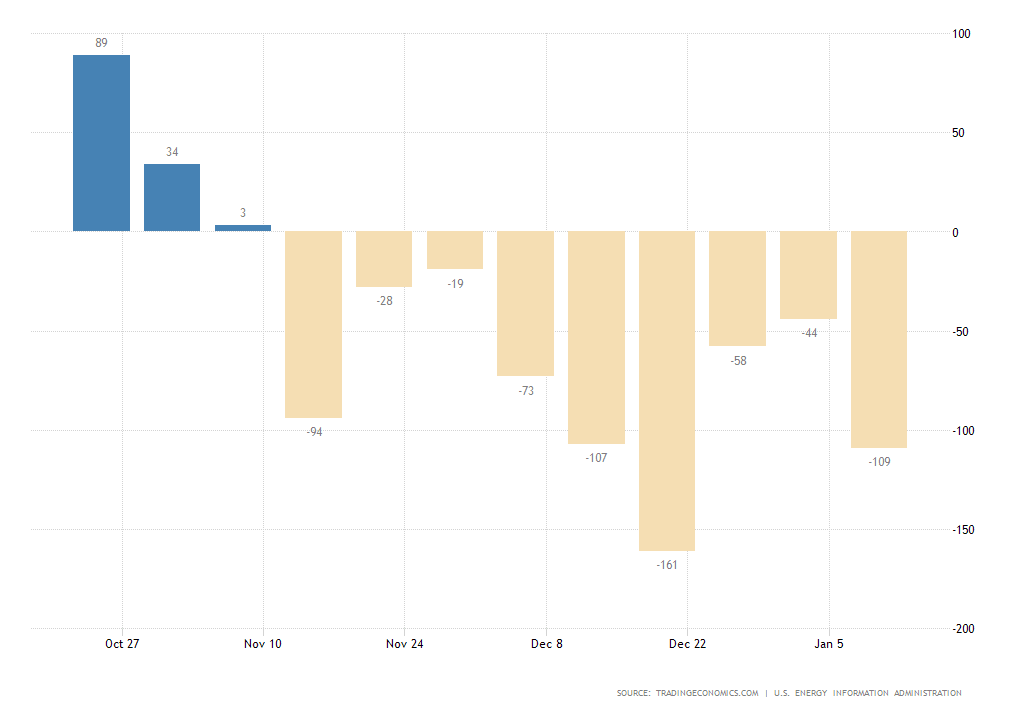
The Energy Information Administration (EIA) reported on Thursday that the Natural Gas storage facilities in the U.S. fell to 109 Billion cubic feet, which is the lowest level for the last two weeks. However, this decline was not enough to boost its price.
Technical Overview
Natural Gas, in its weekly chart in log scale, exposes the corrective process, which currently is a (C) wave in progress of intermediate degree, here labeled in blue.

From the chart, we observe that the commodity of the energy group continues being under bearish pressure and could continue extending its dip below the psychological level at $2 per BBTU.
The following chart illustrates Natural Gas in its daily timeframe. From this figure, we observe the price action running in a descending wedge, or, in Elliott Wave terms, an ending diagonal pattern in progress.

Although the structure suggests the latent potential reversal movement, the price action continues being driven by the sell-side. In consequence, while Natural Gas keeps moving below the 2.254 level, the trend will continue dominated by the bearish sentiment.
From the latest CFTC report released on past Friday, institutional traders also revealed that their current sentiment about the Natural Gas continues to lean toward the sell-side.

Institutional traders reported that their net positioning increased to 368,320 contracts or 1.984%, which represents an increment in the sell-side positioning.
That can be inferred as institutional traders reported an increase of 8.78% in the long-side and a raise of 5.61% in the short-side. Overall, institutional traders have shown a total of 64.99% of short positions.

In consequence, the market sentiment on Natural Gas continues being dominated by the bearish sentiment. The large percentage on the intitutional positioning on the bearish side, added to the fact that the price action continues revealing weak signals, makes us anticipate more declines as long as the price remains below $2.254.
Author

EagleFX Team
EagleFX
EagleFX Team is an international group of market analysts with skills in fundamental and technical analysis, applying several methods to assess the state and likelihood of price movements on Forex, Commodities, Indices, Metals and


