Natural Gas Elliott Wave analysis

Since late May, Natural Gas prices have remained volatile. However, the upward trend that began on April 24 is expected to extend towards the early April price range of $4.00 to $4.25 in the near term. The bias remains bullish as long as the price stays above the April 24 low of $2.858.

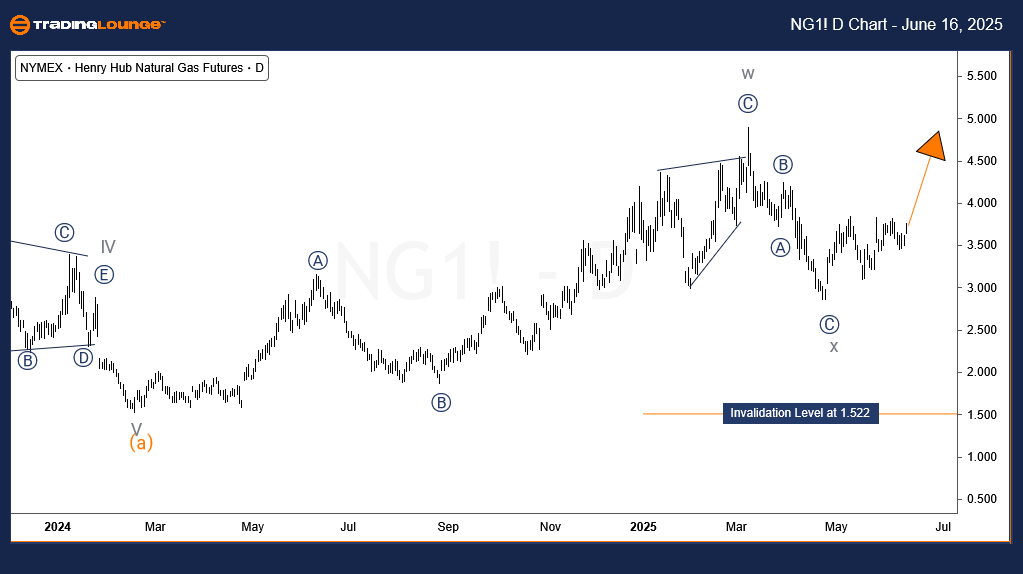
Natural Gas daily chart analysis

Natural Gas completed a significant bearish impulse cycle between August 2022 and February 2024. Based on Elliott Wave principles, a 5-wave trend is typically followed by a 3-wave correction. This correction began in February 2024.

The initial 3-wave upward structure from February ended in March 2025, which may have completed the correction phase. Under typical wave theory, another 5-wave bearish move would be expected to resume the larger downtrend. However, what followed was another 3-wave decline that ended on April 24, 2025, marking the beginning of a new upward phase.

This suggests that the February correction may not be complete and could evolve into a double correction, possibly reaching as high as $6.23. Yet, the current bounce from April has not confirmed whether it will form a full 5-wave or another 3-wave move upward, making both outcomes plausible.

In the short to medium term, at least a 3-wave rally from the April low is anticipated, with targets in the $4.09 to $4.47 range.

Chart

Natural Gas H4 chart analysis

The 4-hour chart highlights the smaller wave structures forming since the April 2025 low. Two swings, labeled as wave (1) and (2), have completed, and the third—wave (3)—is currently underway.

If this move is part of a 5-wave impulse, it could rise beyond $4.70, suggesting a double correction is developing from the February low. Alternatively, if it concludes within the $4.09–$4.47 range, it may indicate only a 3-wave corrective pattern, potentially leading to a continuation of the downtrend from March 2025.

Chart

Natural Gas Elliott Wave analysis [Video]

As with any investment opportunity there is a risk of making losses on investments that Trading Lounge expresses opinions on.

Historical results are no guarantee of future returns. Some investments are inherently riskier than others. At worst, you could lose your entire investment. TradingLounge™ uses a range of technical analysis tools, software and basic fundamental analysis as well as economic forecasts aimed at minimizing the potential for loss.

The advice we provide through our TradingLounge™ websites and our TradingLounge™ Membership has been prepared without considering your objectives, financial situation or needs. Reliance on such advice, information or data is at your own risk. The decision to trade and the method of trading is for you alone to decide. This information is of a general nature only, so you should, before acting upon any of the information or advice provided by us, consider the appropriateness of the advice considering your own objectives, financial situation or needs. Therefore, you should consult your financial advisor or accountant to determine whether trading in securities and derivatives products is appropriate for you considering your financial circumstances.

Recommended Content


Recommended Content

Editors’ Picks

AUD/USD: The 200-day SMA holds the downside

AUD/USD: The 200-day SMA holds the downside

AUD/USD regained some balance, faded three daily pullbacks in a row, and regained the 0.6500 mark and beyond on Wednesday. The Aussie’s recovery came on the back of a sharp reversal in the US Dollar, exacerbated in response to another bout of Trump-Powell effervescence.

EUR/USD: Still room for extra retracements

EUR/USD: Still room for extra retracements

The sudden bout of selling pressure on the Greenback lent some breathing room to the generalised risk complex, prompting EUR/USD to reverse part of its multi-day leg lower and revisit the vicinity of the 1.1800 neighbourhood. Meanwhile, investors will now look at the upcoming US Retail Sales data and the usual weekly gauge of the labour market.

Gold back to its comfort zone around $3,350

Gold back to its comfort zone around $3,350

Gold now manages to leave behind the initial weakness and rapidly advances to the area of three-week peaks around the $3,380 mark per troy ounce as the US Dollar’s retracement gathers extra pace following another round of Trump-Powell effervescence.

Australia unemployment rate expected to hold steady in June

Australia unemployment rate expected to hold steady in June

Australia is set to release the June employment report at 1:30 GMT. The Australian Bureau of Statistics is expected to announce that the country added 20,000 new job positions in the month, reversing the 2,500 lost positions announced in May.

China’s first-half growth remains on track, though activity data signals caution

China’s first-half growth remains on track, though activity data signals caution

China's second-quarter GDP beat forecasts again with a 5.2% year-on-year growth, driven by strong trade and industrial production. Yet sharper-than-expected slowdowns in fixed-asset investment and retail sales and falling property prices are a concern.

Best Brokers for EUR/USD Trading

Best Brokers for EUR/USD Trading

SPONSORED Discover the top brokers for trading EUR/USD in 2025. Our list features brokers with competitive spreads, fast execution, and powerful platforms. Whether you're a beginner or an expert, find the right partner to navigate the dynamic Forex market.

Majors

Cryptocurrencies

Signatures

Best Brokers of 2025