Nat’l Emergency Declared

Good Morning Traders,
As of this writing 4 AM EST, here’s what we see:
US Dollar: March USD is Down at 96.675.
Energies: March '19 Crude is Up at 56.31.
Financials: The Mar 30 year bond is Down 4 ticks and trading at 146.14.
Indices: The Mar S&P 500 emini ES contract is 26 ticks Lower and trading at 2737.00.
Gold: The April Gold contract is trading Up at 1332.00. Gold is 100 ticks Higher than its close.
Initial Conclusion
This is not a correlated market. The dollar is Down-- and Crude is Up+ which is normal and the 30 year Bond is trading Lower as well. The Financials should always correlate with the US dollar such that if the dollar is lower then bonds should follow and vice-versa. The S&P is Lower and Crude is trading Higher which is correlated. Gold is trading Higher which is correlated with the US dollar trading Lower. I tend to believe that Gold has an inverse relationship with the US Dollar as when the US Dollar is down, Gold tends to rise in value and vice-versa. Think of it as a seesaw, when one is up the other should be down. I point this out to you to make you aware that when we don't have a correlated market, it means something is wrong. As traders you need to be aware of this and proceed with your eyes wide open.
At this hour all of Asia is trading Mixed. Currently Europe is trading Lower with the exception of the German Dax which is trading Higher.
Possible Challenges To Traders Today
-
NAHB Housing Market Index is out at 10 AM EST. This is major.
-
Lack of major economic news.
Treasuries
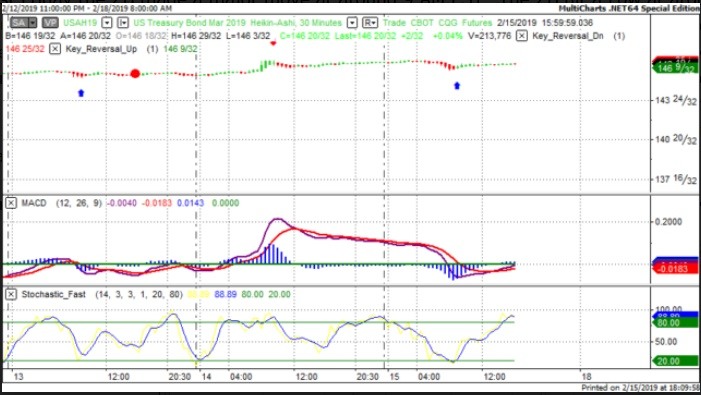
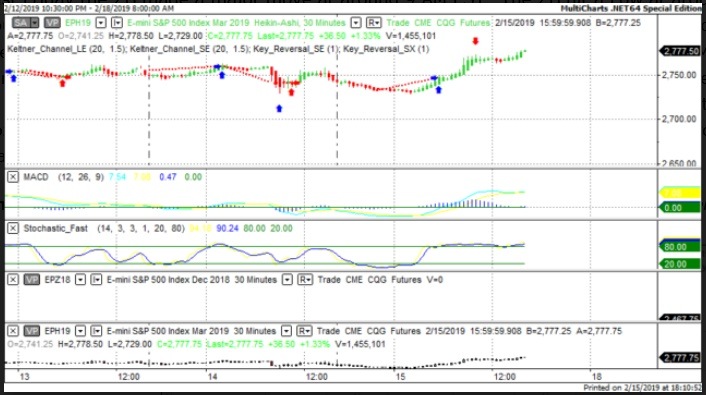
We've elected to switch gears a bit and show correlation between the 30 year bond (ZB) and The YM futures contract. The YM contract is the DJIA and the purpose is to show reverse correlation between the two instruments. Remember it's liken to a seesaw, when up goes up the other should go down and vice versa.
Last Friday the ZB made a major move at around 9 AM EST. The ZB hit a Low at around that time and the YM hit a High. If you look at the charts below ZB gave a signal at around 9 AM EST and the YM was moving Lower at the same time. Look at the charts below and you'll see a pattern for both assets. ZB hit a Low at around 9 AM and the YM was moving Lower at the same time. These charts represent the newest version of MultiCharts and I've changed the timeframe to a 30 minute chart to display better. This represented a Shorting opportunity on the 30 year bond, as a trader you could have netted about a dozen ticks per contract on this trade. Each tick is worth $31.25. Please note: the front month for the ZB contract is now March, 2019
Charts Courtesy of MultiCharts built on an AMP platform.
Bias
Last Friday we gave the markets a Downside bias as both the USD and the Bonds were trading Higher and this usually signals a downside day. The markets however had other plans as the Dow gained 444 points and the other indices gained ground as well. Today we aren't dealing wit a correlated market and our bias is Neutral.
Could this change? Of Course. Remember anything can happen in a volatile market.
Commentary
Last Friday morning we gave the markets a Downside bias as the USD and the Bonds were trading Higher. So what happened? The Dow went higher by 444 points and the other indices gained ground as well. President Trump declared a National Emergency regarding the southern border with Mexico and the markets soared. Ordinarily given such a dire situation, the markets should have retreated but didn't. Trump is getting part of the funds from the bill he just signed averting a government shutdown but the rest of the funds will come from the Defense Spending Budget. My own personal take is the markets went up because a sitting President is keeping his word and pre election promise.
Author

Nick Mastrandrea
Market Tea Leaves


