National rent prices decline again, but reports are very misleading

Apartment List reports the fourth consecutive drop in apartment rent prices but that may not translate to your next lease.
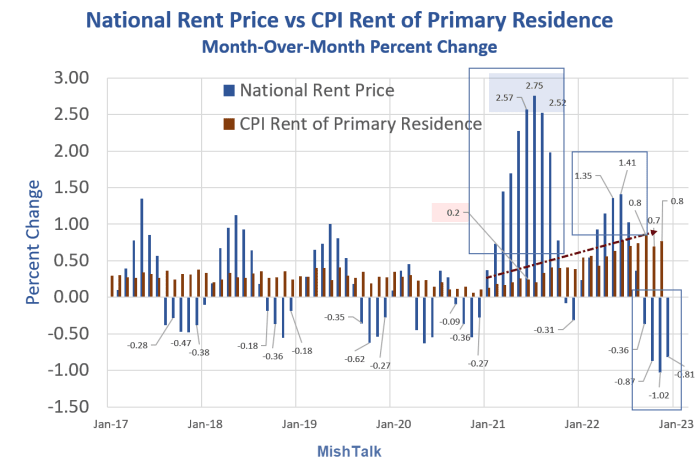
National rent price data from ApartmentList, OER and CPI data from the BLS, chart by Mish
National Rent Report
Please consider the latest National Rent Report by Apartment List.
Our national index fell by 0.8 percent over the course of December, marking the fourth straight month-over-month decline. The timing of this cooldown in the rental market is consistent with the typical seasonal trend, but its magnitude has been notably sharper than what we’ve seen in the past. This suggests that the recent swing to falling rents is reflective of a broader shift in market conditions beyond seasonality alone. As we look ahead to the new year, we expect that 2023 will see bargaining power shift back to renters, and that rent prices this year will grow only modestly, if at all.
Over the course of 2022 as a whole, the national median rent increased by a total of 3.8 percent. This means that last year represented a return to pre-pandemic levels of rent growth, after the astronomical 17.6 percent spike in rents that we saw in 2021. Rent growth in 2022 still ranks as the second fastest year in the history of our estimates (going back to 2017), but it came in just barely ahead of the 3.5 percent rate from 2018.
The cooldown in rent growth is being mirrored by continued easing on the supply side of the market. Our vacancy index now stands at 5.9 percent, after more than a year of gradual increases from a low of 4.1 percent last fall. And in the past four months, this easing of the vacancy rate has picked up steam again, after plateauing a bit over the course of last summer. Today’s vacancy rate still remains slightly below the pre-pandemic norm, but is quickly approaching that benchmark.
Rent Decreases in 90 of Top 100 Cities
The recent slowdown has been geographically widespread. Rents decreased in December in 90 of the nation’s 100 largest cities. New York City saw the nation’s sharpest decline, with prices down by 3 percent month-over-month. And over a longer horizon, we are continuing to see an ongoing cooldown in many of the recently booming Sun Belt markets. Las Vegas, Phoenix, Jacksonville, and Riverside all rank in the top 10 for fastest rent growth since March 2020, but none of these metros has seen rents increase by more than 1 percent over the past twelve months.
Are Rents Declining?
From a CPI point of view, I don't believe we will see rents decline significantly, if at all, just yet.
It's not that the ApartmentList data is wrong. Rather, it has to do with what they measure.
First, let's consider how things look year-over-over-year.
Percent Change From Year Ago
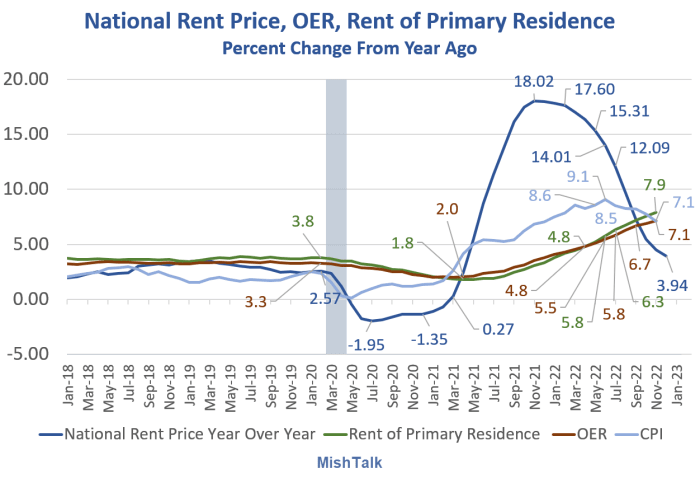
National rent price data from ApartmentList, OER and CPI data from the BLS, chart by Mish
Chart Notes
- The National Rent Price is from ApartmentList.Com.
- OER stands for Owners' Equivalent Rent, the price one would pay to rent one's own house from oneself, unfurnished and without utilities.
- Rent of Primary residence is just what it sound like, typical rent. That number and OER are from the BLS.
Apartment List Stated Methodology
- "We calculate growth rates using a same-unit analysis similar to Case-Shiller’s approach, comparing only units for which we observe transactions in multiple time periods to provide an accurate picture of rent growth that controls for compositional changes in the available inventory."
- "We capture repeat transactions - when a single apartment gets rented more than once over time - and check whether the transacted rent price has changed between those transactions."
- "Rent estimates reflect prices paid by renters, not list prices for units that remain vacant."
Three Key Difference to BLS
- Although Apartment List uses repeat rents of the same or similar unit and prices are are actual prices, not asking prices, it only shows new leases, not repeat leases.
- Because new leases on vacant units rise much more rapidly than existing leases, its year-over-year numbers rise or fall faster and in greater magnitude.
- The National Rent price reflects year-over-year changes, but in reality, people pay the same amount of rent for 12 months then there is one big price jump.
Point number 2 above reflects the huge 18 percent year-over-year-peak vs 7.5 percent for rent of primary residence.
The lead chart also shows 2.5 percent month over month growth for three consecutive months with the BLS reporting 0.2 percent growth.
Seasonal Tendencies
The strong seasonal tendencies of Apartment List are smoothed over by the BLS every year. This year will be no different.
To explain the magnitude change this year, including a record 1 percent decline in November, just look at the massive spikes this year and last that preceded it.
Remember, ApartmentList reflects new leases not renewals of existing leases. With Covid, there was a huge increase in work-at-home and huge demand from people escaping the cities to the suburbs.
Finally, note the time lag between ApartmentList and the CPI.
BLS Look Ahead
The above charts provide a needed reality check to those who think rent prices are about to plunge based off Apartment List data.
Last month I commented "I suspect we have strong increases in rent in the CPI data despite the declines of ApartmentList for at least the rest of the year, and if so continuing into 2023."
The November CPI confirmed that view as noted in CPI Cools Significantly in November But Rent and Food Still Sharply Increasing
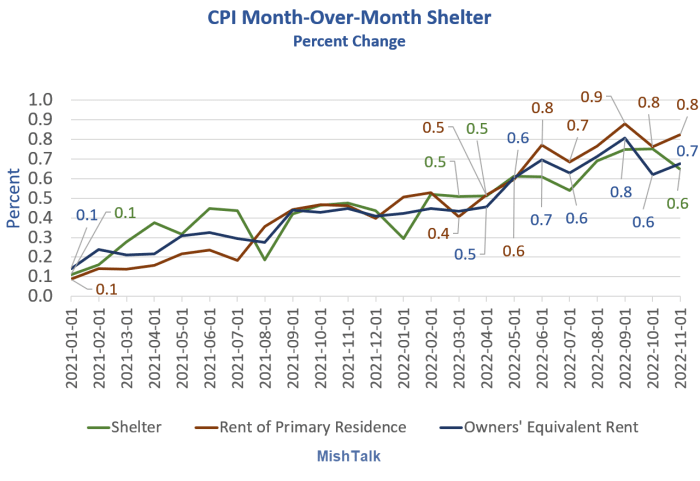
CPI Shelter, Rent of Primary Residence, Owners' Equivalent Rent (OER), chart by Mish
At some point the rate of increases will slow, but don't expect huge declines yet. For now, the trend is still up.
New Homes Under Construction
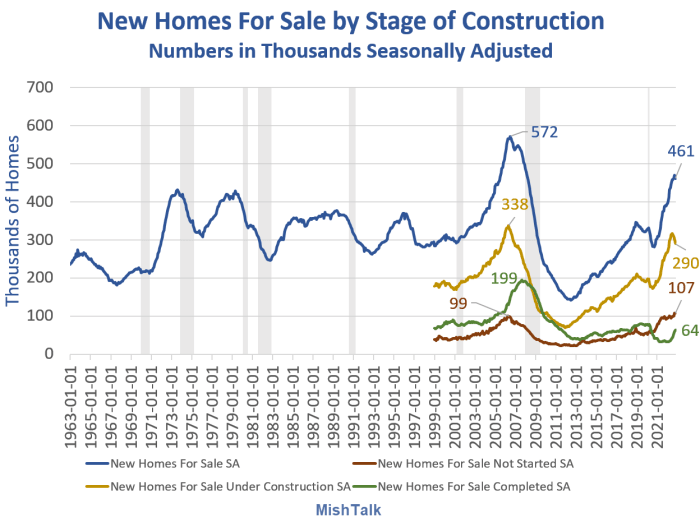
New home sales report by stage of construction from Census Department, chart by Mish
This year there will be a huge number of apartment construction completions. That is more likely to have an impact than the exaggerated seasonal tendencies of ApartmentList.
Again, I don't question their data, one just needs to understand what it means.
The New Home Sales Report Is Another Negative Revision Swamp in November
For discussion of homes under construction, please see The New Home Sales Report Is Another Negative Revision Swamp in November.
Author

Mike “Mish” Shedlock's
Sitka Pacific Capital Management,Llc


