NAHB Propels Dow Toward 23,000

Good Morning Traders,
As of this writing 4:20 AM EST, here's what we see:
US Dollar: Dec. USD is Up at 93.420.
Energies: Nov Crude is Up at 52.30.
Financials: The Dec 30 year bond is Down 10 ticks and trading at 153.24.
Indices: The Dec S&P 500 emini ES contract is 3 ticks Higher and trading at 2557.75.
Gold: The Dec gold contract is trading Down at 1285.30. Gold is 9 ticks Lower than its close.
Initial Conclusion
This is not a correlated market. The dollar is Up+ and Crude is Up+ which is not normal but the 30 year Bond is trading Lower. The Financials should always correlate with the US dollar such that if the dollar is lower then bonds should follow and vice-versa. The indices are Higher and Crude is trading Up+ which is not correlated. Gold is trading Down which is correlated with the US dollar trading Up+. I tend to believe that Gold has an inverse relationship with the US Dollar as when the US Dollar is down, Gold tends to rise in value and vice-versa. Think of it as a seesaw, when one is up the other should be down. I point this out to you to make you aware that when we don't have a correlated market, it means something is wrong. As traders you need to be aware of this and proceed with your eyes wide open.
At this hour all of Asia is trading Mixed with half the exchanges Higher and the other half Lower. As of this writing Europe is trading Mixed as well.
Possible Challenges To Traders Today
-
FOMC Member Dudley Speaks at 8 AM EST, this is major.
-
FOMC Member Kaplan Speaks at 8 AM. This is major.
-
Building Permits are out at 8:30 AM EST. This is major.
-
Housing Starts are out at 8:30 AM. This is major.
-
Crude Oil Inventories are out at 10:30 AM. This is major.
-
Beige Book is out at 2 PM. This is major.
Treasuries
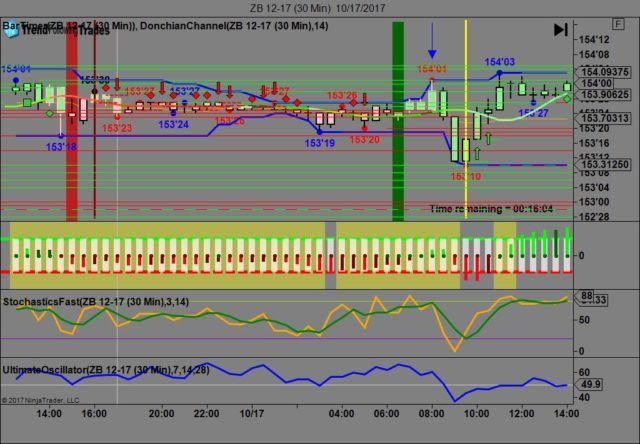
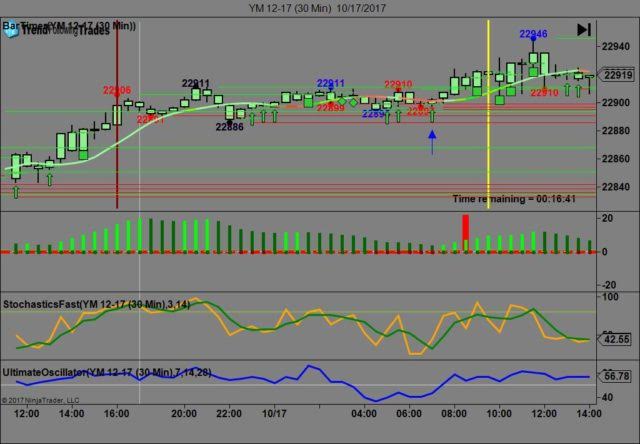
We've elected to switch gears a bit and show correlation between the 30 year bond (ZB) and The YM futures contract. The YM contract is the DJIA and the purpose is to show reverse correlation between the two instruments. Remember it's liken to a seesaw, when up goes up the other should go down and vice versa.
Yesterday the ZB made it's move at around 8 AM EST. The ZB hit a High at around that time and the YM hit a Low. If you look at the charts below ZB gave a signal at around 8 AM EST and the YM was moving Higher at the same time. Look at the charts below and you'll see a pattern for both assets. ZB hit a High at around 8 AM and the YM hit a Low. These charts represent the newest version of Trend Following Trades and I've changed the timeframe to a 30 minute chart to display better. This represented a Shorting opportunity on the 30 year bond, as a trader you could have netted about 20 ticks per contract on this trade. Each tick is worth $31.25. We added a Donchian Channel to the charts to show the signals more clearly. Please note that the front month for the ZB and the YM contract is now December, 2017.
Charts Courtesy of Trend Following Trades built on a NinjaTrader platform
Bias
Yesterday our bias was to the Downside as our rules suggested a downside bias. The Dow advanced 40 points, the S&P advanced 2 but the Nasdaq fell by 1 point. Today we aren't dealing with a correlated market however our bias is to the Upside.
Could this change? Of Course. Remember anything can happen in a volatile market.
Commentary
Once again the Dow is on a roll and breached 23,000 earlier yesterday but not by much. It will take the Smart Money more buying power to make that happen and sooner or later they will make that happen. As we stated yesterday the markets want to advance and they will but they need more horsepower (buying capital) to do so. Today we have Building Permits and Housing Starts to drive this market, both are real estate related and anything RE related can and will drive the US markets.
Author

Nick Mastrandrea
Market Tea Leaves


