USD/JPY, “US Dollar vs. Japanese Yen”
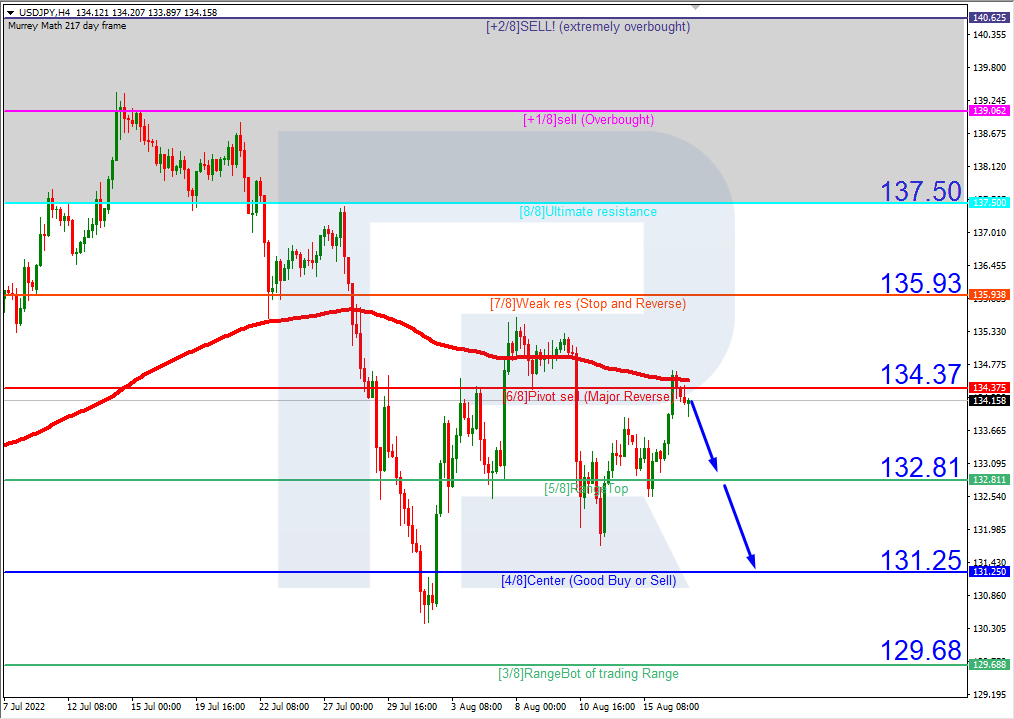
As we can see in the H4 chart, USDJPY is trading below the 200-day Moving Average to indicate a descending tendency. In this case, the price is expected to test the support at 5/8, break it, and then continue falling and reach 4/8. However, this scenario may no longer be valid if the price breaks the resistance at 6/8 to the upside. After that, the instrument may reverse and grow towards 7/8.
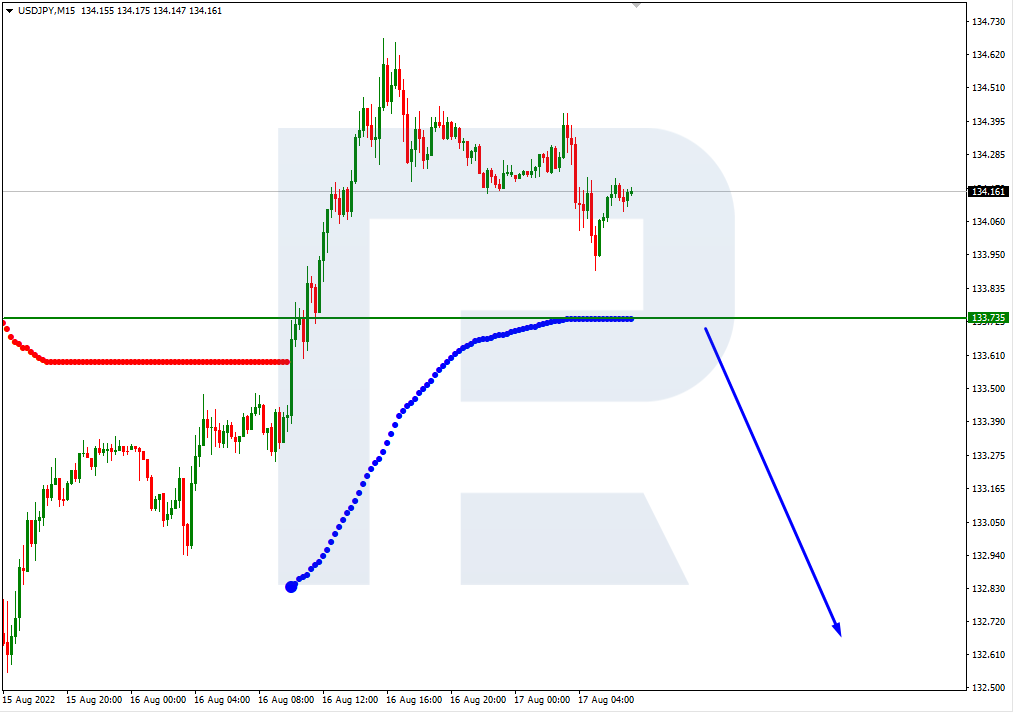
In the M15 chart, the pair may break the downside line of the VoltyChannel indicator and, as a result, continue its decline.
USD/CAD, “US Dollar vs Canadian Dollar”
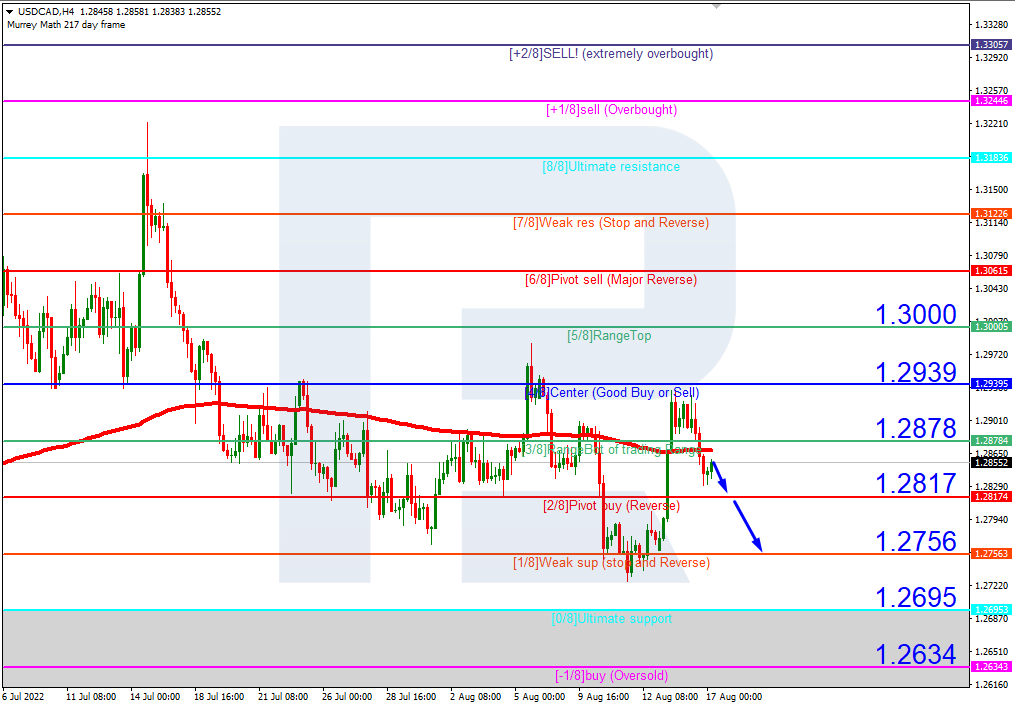
In the H4 chart, after breaking the 200-day Moving Average, USDCAD is trading below it, thus indicating a possible descending tendency. In this case, the price is expected to break 2/8 and continue falling towards the support at 1/8. On the other hand, this scenario may no longer be valid if the pair breaks the resistance at 3/8 to the upside. After that, the instrument may reverse and grow to reach 5/8.
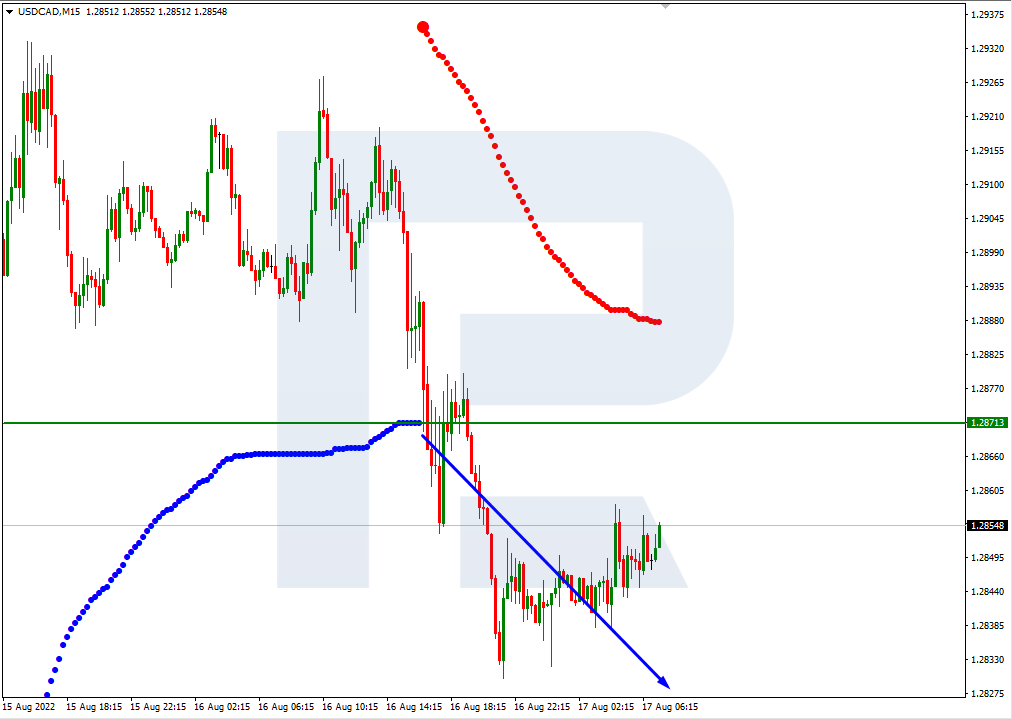
As we can see in the M15 chart, the pair has broken the downside line of the VoltyChannel indicator and, as a result, may continue trading downwards.
Before you enter foreign exchange and stock markets, you have to remember that trading currencies and other investment products is trading in nature and always involves a considerable risk. As a result of various financial fluctuations, you may not only significantly increase your capital, but also lose it completely. Therefore, our clients have to assure RoboForex that they understand all the possible consequences of such risks, they know all the specifics, rules and regulations governing the use of investment products, including corporate events, resulting in the change of underlying assets. Client understands that there are special risks and features that affect prices, exchange rates and investment products.
Recommended Content
Editors’ Picks
EUR/USD trades weak below 1.0800 amid Good Friday lull, ahead of US PCE
EUR/USD remains depressed below 1.0800 after soft French inflation data, amid minimal volatility and thin liquidity on Good Friday. The pair keenly awaits the US PCE inflation data and Fed Chair Powell's speech for fresh hints on next week's price action.
GBP/USD holds steady above 1.2600 as markets stay calm on Good Friday
GBP/USD trades sideways above 1.2600 amid a typical Good Friday trading lull. A broadly firmer US Dollar could keep any upside attempts limited in the pair ahead of the US PCE inflation data and Fed Chair Powell's appearance.
Gold price sits at all-time highs above $2,230, US PCE eyed
Gold price hit all-time highs at $2,236 on Thursday to finish Q1 2024 with a bang. Most major world markets, including the US are closed due to Holy Friday, leaving volatility around Gold price highly subdued. US PCE inflation and Powell are awaited.
Jito price could hit $6 as JTO coils up inside this bullish pattern
Jito (JTO) price has been on an uptrend since forming a local bottom in early January. Since then, JTO has revisited the key swing point formed in early December, suggesting the bulls’ intention to move higher.
Key events in developed markets next week
Next week, the main focus will be inflation and the labour market in the Eurozone. We expect services inflation to be impacted by the easter effect, while the unemployment rate to be unchanged.