EUR/USD, “Euro vs US Dollar”

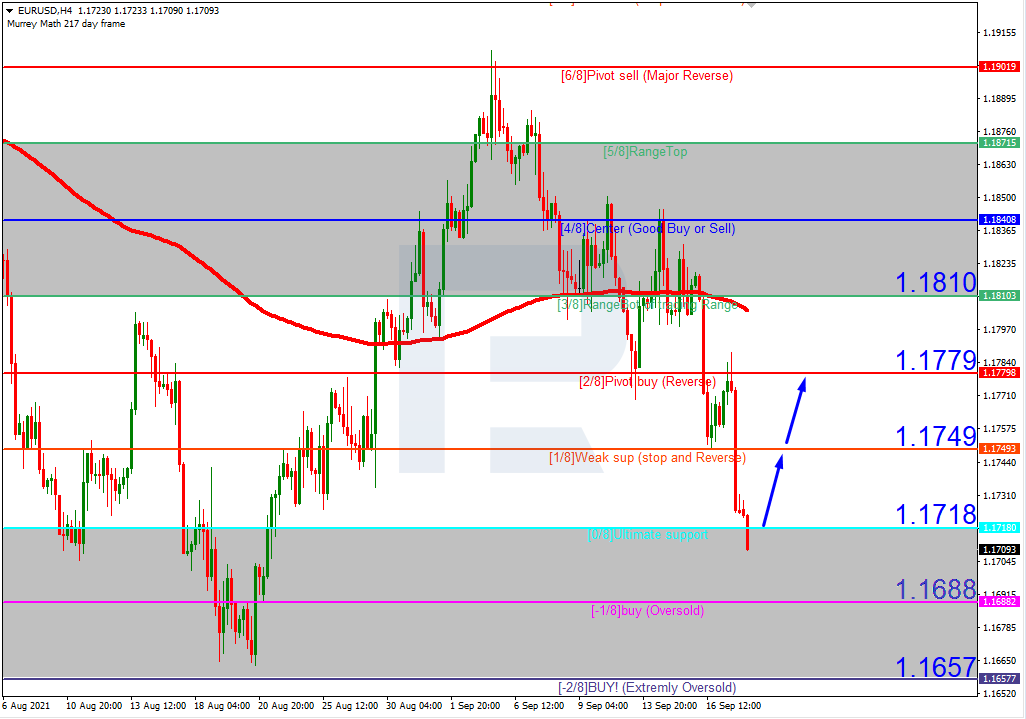
As we can see in the H4 chart, EURUSD is trading within the “oversold area”. In this case, the price is expected to break 0/8 and then continue growing to reach the resistance at 2/8. Still, this scenario may no longer be valid if the price breaks -1/8 to the downside. After that, the instrument may continue falling and reach the support at -2/8.

EURUSD

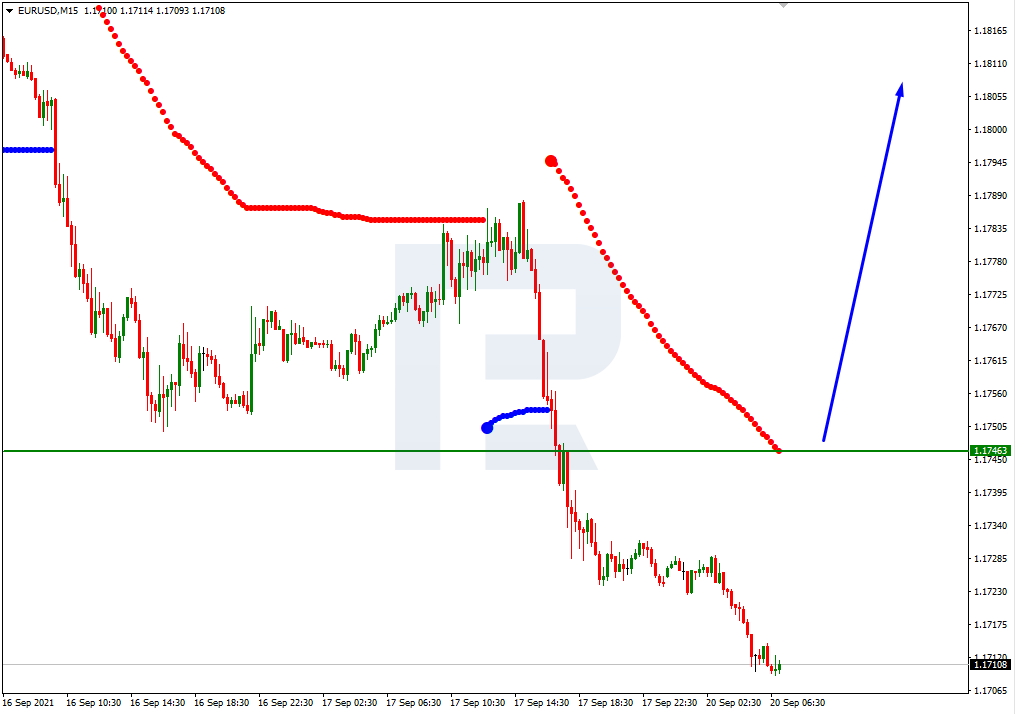
In the M15 chart, the pair may break the upside line of the VoltyChannel indicator and, as a result, may continue its growth.

EURUSD

GBP/USD, “Great Britain Pound vs US Dollar”

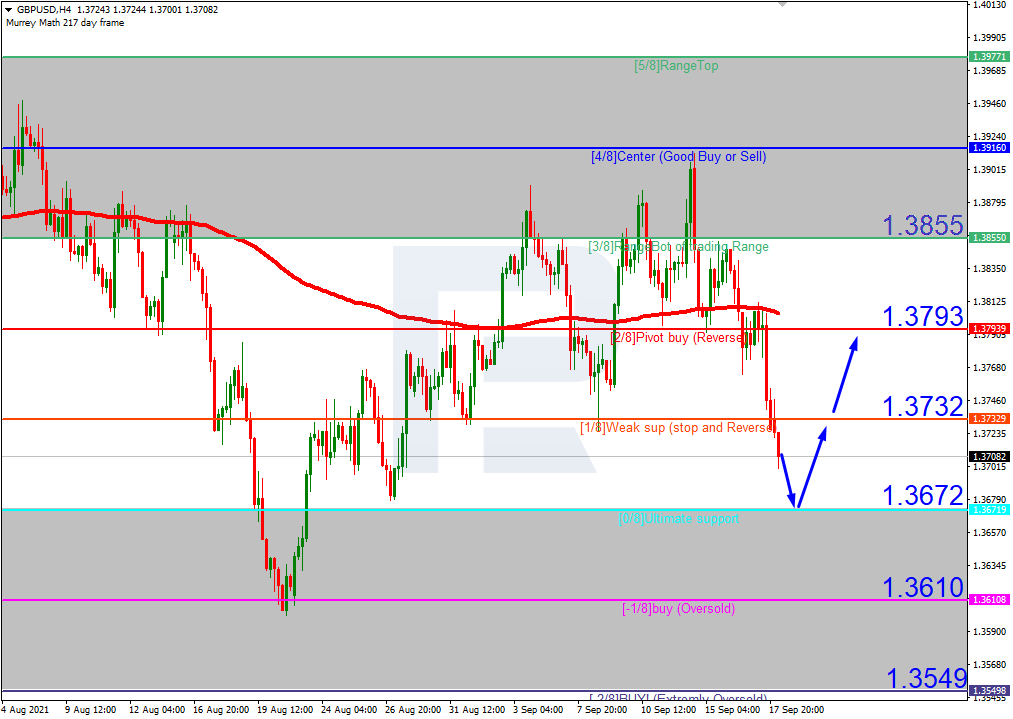
In the H4 chart, GBPUSD is approaching the “oversold area”. In this case, the asset is expected to test 0/8, rebound from it, and then resume growing towards the resistance at 2/8. However, this scenario may no longer be valid if the price breaks 0/8 to the downside. After that, the instrument may continue falling to reach the support at -1/8.

GBPUSD

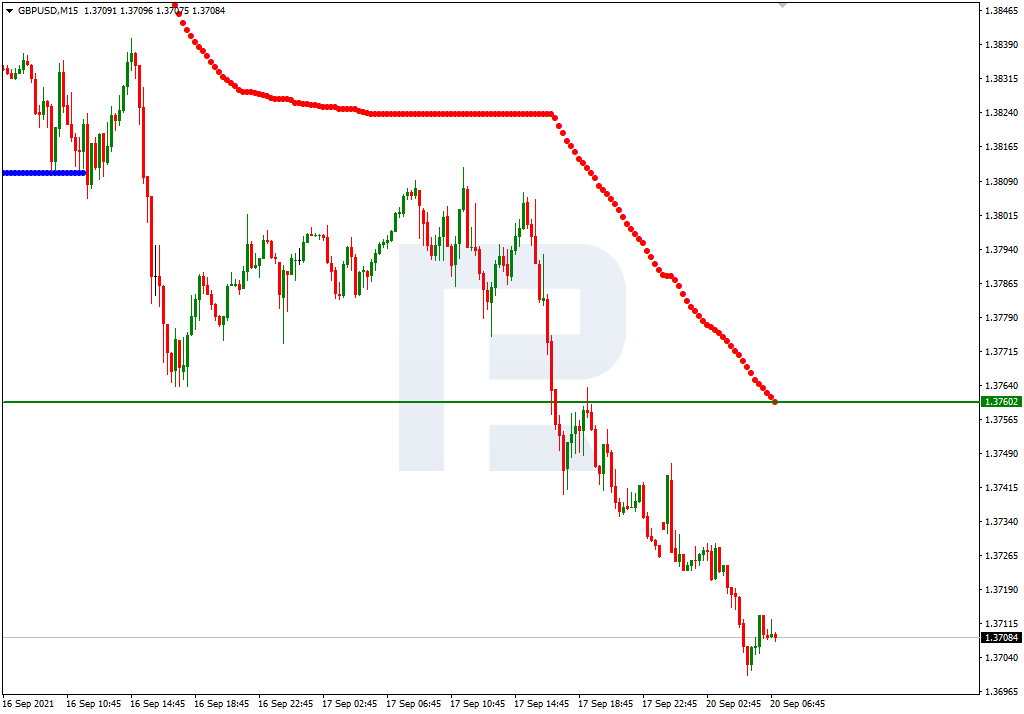
As we can see in the M15 chart, the upside line of the VoltyChannel indicator is pretty far away from the price, that’s why the pair may resume the ascending tendency only after rebounding from 0/8 from the H4 chart.

GBPUSD

Before you enter foreign exchange and stock markets, you have to remember that trading currencies and other investment products is trading in nature and always involves a considerable risk. As a result of various financial fluctuations, you may not only significantly increase your capital, but also lose it completely. Therefore, our clients have to assure RoboForex that they understand all the possible consequences of such risks, they know all the specifics, rules and regulations governing the use of investment products, including corporate events, resulting in the change of underlying assets. Client understands that there are special risks and features that affect prices, exchange rates and investment products.

Recommended Content


Recommended Content

Editors’ Picks

EUR/USD trades with negative bias, holds above 1.0700 as traders await US PCE Price Index

EUR/USD trades with negative bias, holds above 1.0700 as traders await US PCE Price Index

EUR/USD edges lower during the Asian session on Friday and moves away from a two-week high, around the 1.0740 area touched the previous day. Spot prices trade around the 1.0725-1.0720 region and remain at the mercy of the US Dollar price dynamics ahead of the crucial US data.

EUR/USD News

USD/JPY jumps above 156.00 on BoJ's steady policy

USD/JPY jumps above 156.00 on BoJ's steady policy

USD/JPY has come under intense buying pressure, surging past 156.00 after the Bank of Japan kept the key rate unchanged but tweaked its policy statement. The BoJ maintained its fiscal year 2024 and 2025 core inflation forecasts, disappointing the Japanese Yen buyers. 

USD/JPY News

Gold price flatlines as traders look to US PCE Price Index for some meaningful impetus

Gold price flatlines as traders look to US PCE Price Index for some meaningful impetus

Gold price lacks any firm intraday direction and is influenced by a combination of diverging forces. The weaker US GDP print and a rise in US inflation benefit the metal amid subdued USD demand. Hawkish Fed expectations cap the upside as traders await the release of the US PCE Price Index.

Gold News

Sei Price Prediction: SEI is in the zone of interest after a 10% leap

Sei Price Prediction: SEI is in the zone of interest after a 10% leap

Sei price has been in recovery mode for almost ten days now, following a fall of almost 65% beginning in mid-March. While the SEI bulls continue to show strength, the uptrend could prove premature as massive bearish sentiment hovers above the altcoin’s price.

Read more

US economy: Slower growth with stronger inflation

US economy: Slower growth with stronger inflation

The US Dollar strengthened, and stocks fell after statistical data from the US. The focus was on the preliminary estimate of GDP for the first quarter. Annualised quarterly growth came in at just 1.6%, down from the 2.5% and 3.4% previously forecast.

Read more

Majors

Cryptocurrencies

Signatures