Murrey math lines: Brent, S&P 500

Brent
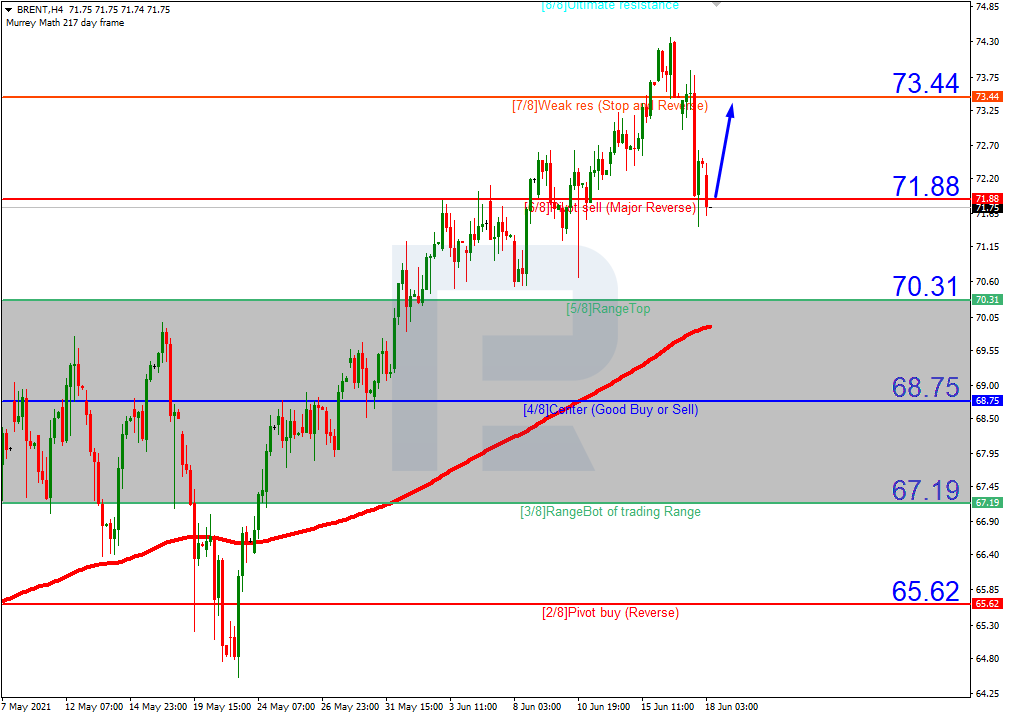
As see can see in the H4 chart, Brent is trading above the 200-day Moving Average, thus indicating an ascending tendency. In this case, the price is expected to break 6/8 and then continue growing towards the resistance at 7/8. However, this scenario may no longer be valid if the price breaks 5/8 to the downside. After that, the instrument may move downwards and reach the support at 4/8.
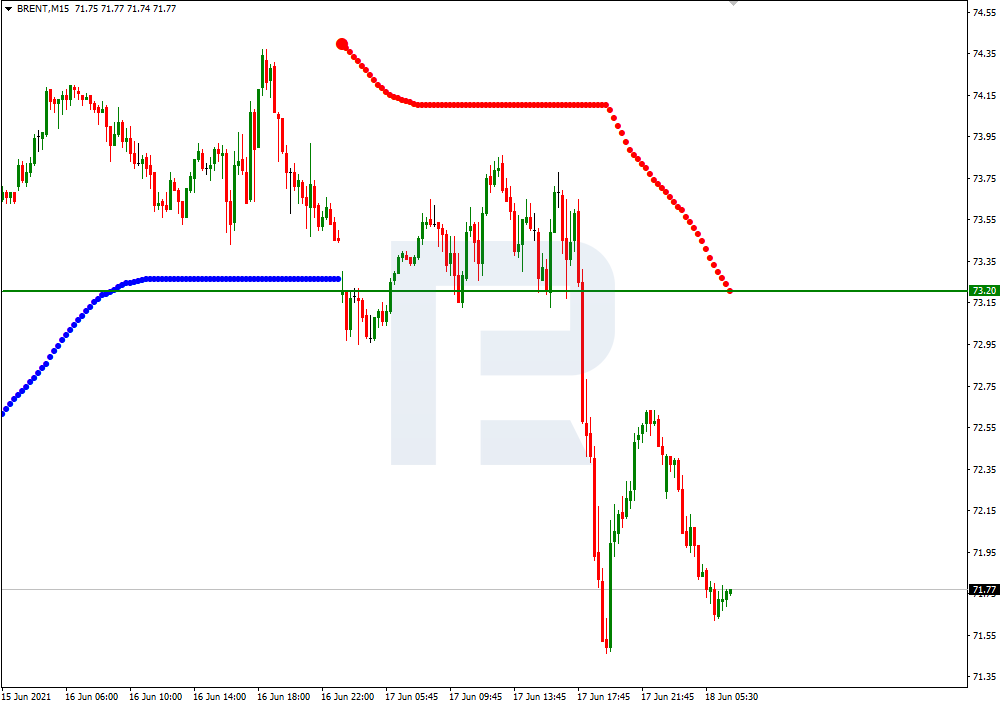
In the M15 chart, the upside line of the Volty Channel indicator is pretty far away from the price, that’s why the pair may resume growing only after breaking 6/8 from the H4 chart.
S&P 500
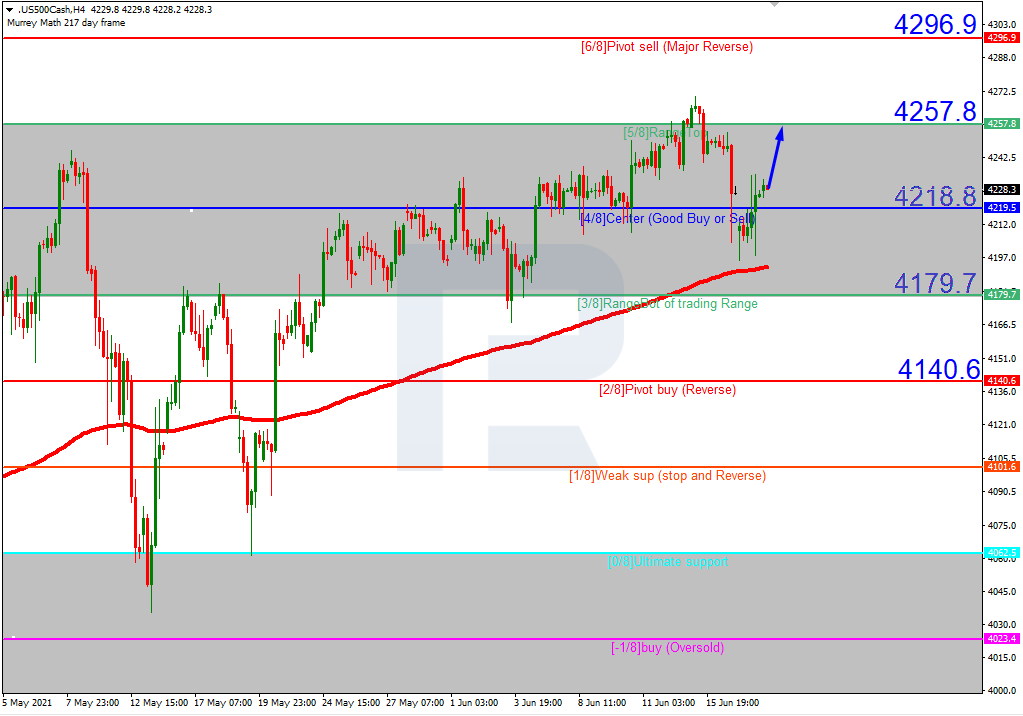
As we can see in the H4 chart, the S&P Index is trading above the 200-day Moving Average, thus indicating an ascending tendency, and has already broken 4/8. In this case, the price is expected to continue growing towards the resistance at 5/8. However, this scenario may no longer be valid if the price breaks 4/8 to the downside. After that, the instrument may fall to reach the support at 3/8.
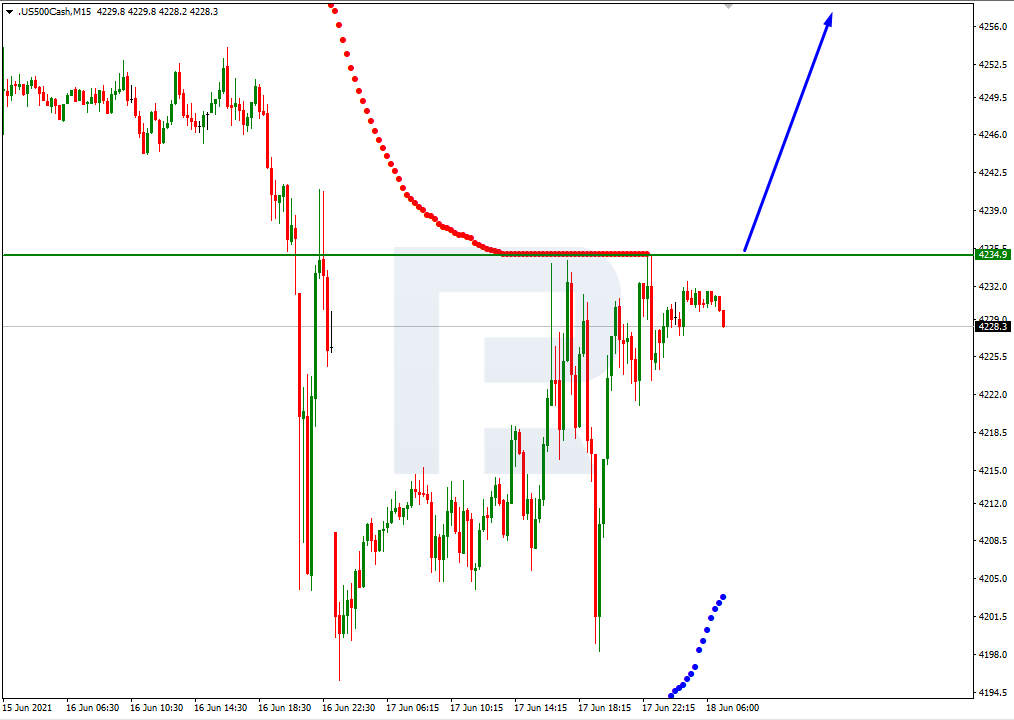
in the M15 chart, the pair may break the upside line of the Volty Channel indicator and, as a result, continue trading upwards.
Author

RoboForex Team
RoboForex
RoboForex Team is a group of professional financial experts with high experience on financial market, whose main purpose is to provide traders with quality and up-to-date market information.


