AUD/USD, “Australian Dollar vs US Dollar”

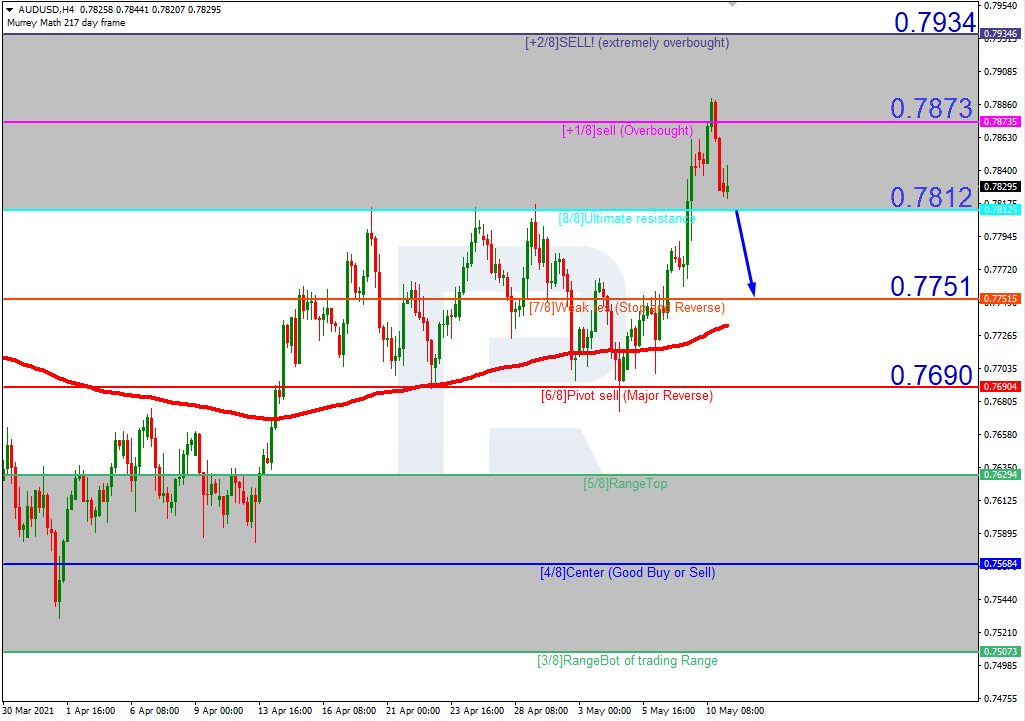
In the H4 chart, AUDUSD is trading inside the “overbought area”. In this case, the price is expected to break 8/8 and then continue moving downwards to reach the closest support at 7/8. However, this scenario may be canceled if the price breaks +1/8 to the upside. After that, the instrument may reverse and grow towards the resistance at +2/8.

AUDUSD

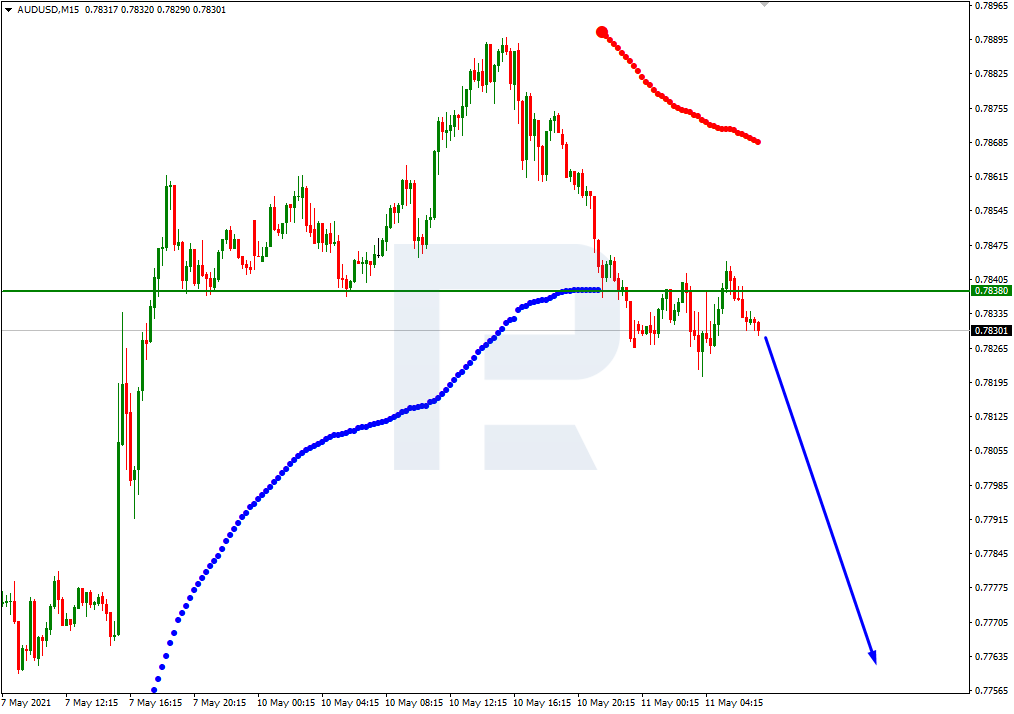
As we can see in the M15 chart, the pair has broken the downside line of the VoltyChannel indicator and, as a result, may continue its decline.

AUDUSD

NZD/USD

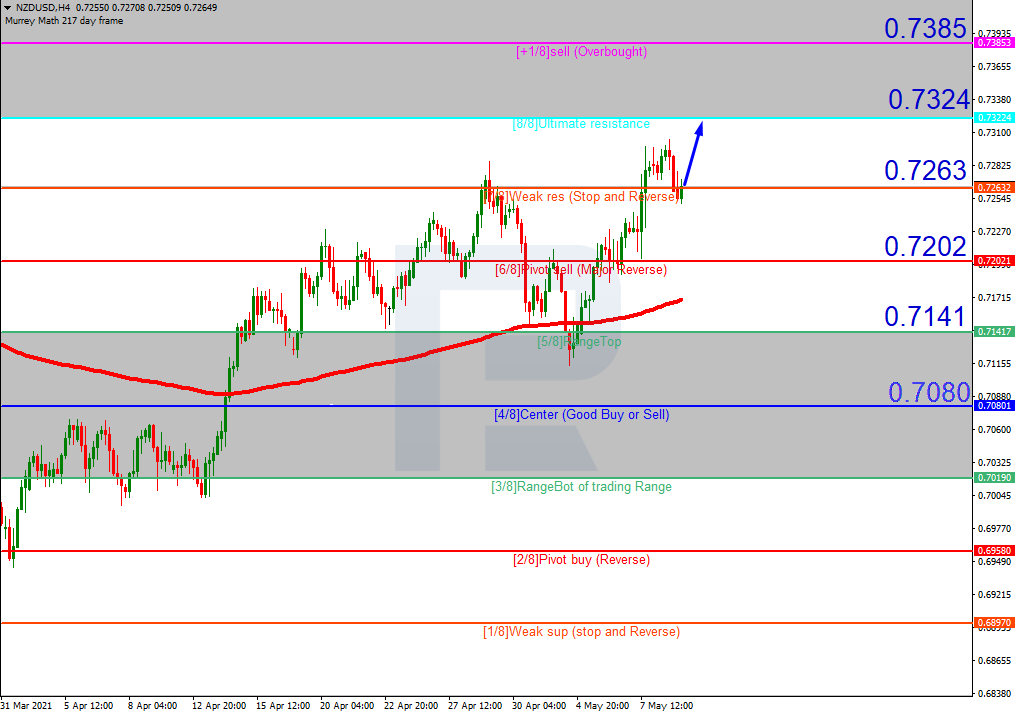
In the H4 chart, NZDUSD is trading above the 200-day Moving Average to indicate an ascending tendency. In this case, the price is expected to break 7/8 and then continue growing to reach the resistance at 8/8. However, this scenario may no longer be valid if the price breaks 6/8 to the downside. In this case, the instrument may fall towards the support at 5/8.

NZDUSD

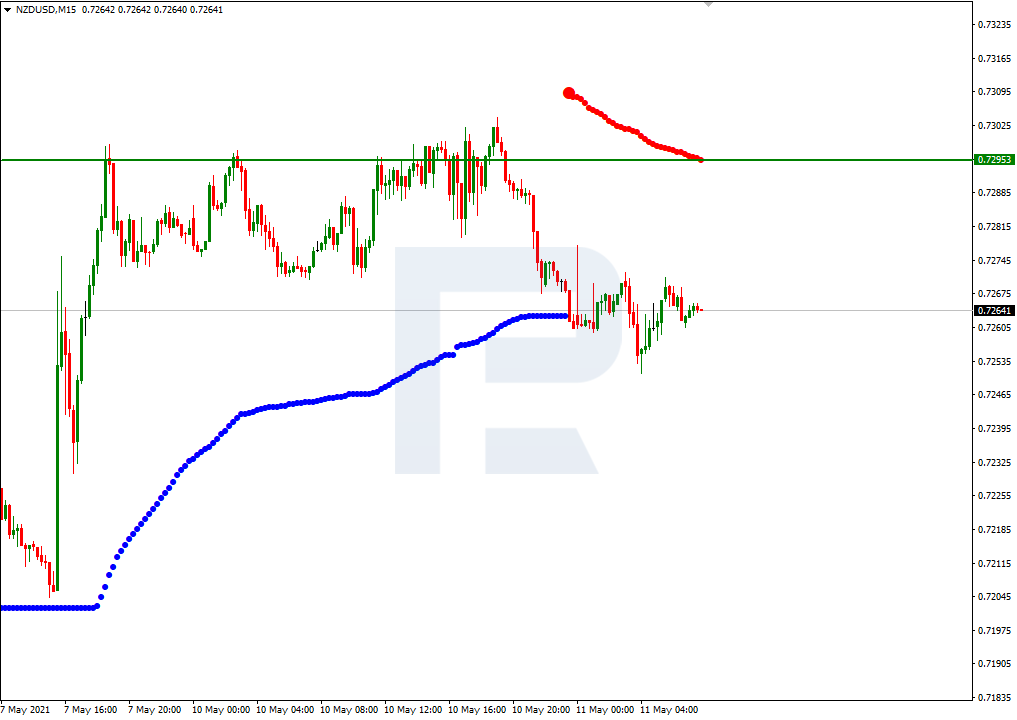
As we can see in the M15 chart, the upside line of the VoltyChannel indicator is pretty far away from the price, that’s why the pair may resume the ascending tendency only after breaking 7/8 from the H4 chart.

NZDUSD

Before you enter foreign exchange and stock markets, you have to remember that trading currencies and other investment products is trading in nature and always involves a considerable risk. As a result of various financial fluctuations, you may not only significantly increase your capital, but also lose it completely. Therefore, our clients have to assure RoboForex that they understand all the possible consequences of such risks, they know all the specifics, rules and regulations governing the use of investment products, including corporate events, resulting in the change of underlying assets. Client understands that there are special risks and features that affect prices, exchange rates and investment products.

Recommended Content


Recommended Content

Editors’ Picks

EUR/USD clings to gains near 1.0700, awaits key US data

EUR/USD clings to gains near 1.0700, awaits key US data

EUR/USD clings to gains near the 1.0700 level in early Europe on Thursday. Renewed US Dollar weakness offsets the risk-off market environment, supporting the pair ahead of the key US GDP and PCE inflation data. 

EUR/USD News

USD/JPY keeps pushing higher, eyes 156.00 ahead of US GDP data

USD/JPY keeps pushing higher, eyes 156.00 ahead of US GDP data

USD/JPY keeps breaking into its highest chart territory since June of 1990 early Thursday, recapturing 155.50 for the first time in 34 years as the Japanese Yen remains vulnerable, despite looming intervention risks. The focus shifts to Thursday's US GDP report and the BoJ decision on Friday. 

USD/JPY News

Gold price lacks firm intraday direction, holds steady above $2,300 ahead of US data

Gold price lacks firm intraday direction, holds steady above $2,300 ahead of US data

Gold price remains confined in a narrow band for the second straight day on Thursday. Reduced Fed rate cut bets and a positive risk tone cap the upside for the commodity. Traders now await key US macro data before positioning for the near-term trajectory.

Gold News

Injective price weakness persists despite over 5.9 million INJ tokens burned

Injective price weakness persists despite over 5.9 million INJ tokens burned

Injective price is trading with a bearish bias, stuck in the lower section of the market range. The bearish outlook abounds despite the network's deflationary efforts to pump the price. Coupled with broader market gloom, INJ token’s doomed days may not be over yet.

Read more

Meta takes a guidance slide amidst the battle between yields and earnings

Meta takes a guidance slide amidst the battle between yields and earnings

Meta's disappointing outlook cast doubt on whether the market's enthusiasm for artificial intelligence. Investors now brace for significant macroeconomic challenges ahead, particularly with the release of first-quarter gross domestic product (GDP) data on Thursday.

Read more

Majors

Cryptocurrencies

Signatures