MLK Day
US Dollar: Mar. USD is Down at 91.350.
Energies: Feb ’18 Crude is Down at 63.39.
Financials: The Mar 30 year bond is Down 10 ticks and trading at 150.04.
Indices: The Mar S&P 500 emini ES contract is 20 ticks Higher and trading at 2774.50.
Gold: The Feb gold contract is trading Down at 1329.10. Gold is 66 ticks Higher than its close.
Initial Conclusion
This is not a correlated market. The dollar is Down- and Crude is Down- which is not normal and the 30 year Bond is trading Lower. The Financials should always correlate with the US dollar such that if the dollar is lower then bonds should follow and vice-versa. The S&P is Higher and Crude is trading Down- which is correlated. Gold is trading Up+ which is correlated with the US dollar trading Down-. I tend to believe that Gold has an inverse relationship with the US Dollar as when the US Dollar is down, Gold tends to rise in value and vice-versa. Think of it as a seesaw, when one is up the other should be down. I point this out to you to make you aware that when we don’t have a correlated market, it means something is wrong. As traders you need to be aware of this and proceed with your eyes wide open.
At this hour Asia is trading Higher with the exception of the Nikkei exchange which is Lower. As of this writing all of Europe is trading Higher.
Possible Challenges To Traders Today
-
CPI m/m is out at 8:30 AM. This is major.
-
Core CPI m/m is out at 8:30 AM EST. This is major.
-
Core Retail Sales m/m is out at 8:30 AM EST. This is major.
-
Retail Sales m/m is out at 8:30 AM EST. This is major.
-
Business Inventories is out at 10 AM EST. This is major.
-
IBD/TIPP Economic Optimism. This is major.
Treasuries
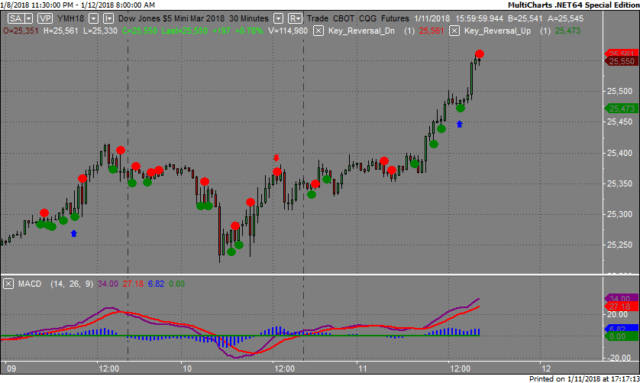
We’ve elected to switch gears a bit and show correlation between the 30 year bond (ZB) and The YM futures contract. The YM contract is the DJIA and the purpose is to show reverse correlation between the two instruments. Remember it’s liken to a seesaw, when up goes up the other should go down and vice versa.
Yesterday the ZB made it’s move at around 1:30 PM EST. The ZB hit a High at around that time and the YM hit a Low. If you look at the charts below ZB gave a signal at around 1:30 PM EST and the YM was moving Higher at the same time. Look at the charts below and you’ll see a pattern for both assets. ZB hit a High at around 1:30 PM and the YM hit a Low. These charts represent the newest version of MultiCharts and I’ve changed the timeframe to a 30 minute chart to display better. This represented a shorting opportunity on the 30 year bond, as a trader you could have netted 15 ticks per contract on this trade. Each tick is worth $31.25.
Charts Courtesy of MultiCharts built on an AMP platform.

Bias
Yesterday we gave the markets a Neutral as the futures didn’t seem to have any sense of direction hence the neutral bias. The Dow 206 points and the other indices gained ground as well. Today we aren’t dealing with a correlated market and our bias is to the Upside.
Could this change? Of Course. Remember anything can happen in a volatile market.
Commentary
Yesterday we gave the markets a neutral bias because we didn’t see any correlation amongst the various instruments we track. The markets started lower, went higher into positive territory and kept climbing. Why? We suspect that the Smart Money is at work here. This is not unusual as often when the markets and it makes no sense for that to occur, the institutionals get involved and ratchet the markets higher. This happened quite often in 2009 when the markets were at an all time low and the term PPT came into play. PPT refers to Plunge Protection Team. It seemed that around that time the Smart Money wanted to make at least 3 points on any one particular index future and would buy or sell thousands at a clip. In one respect it helped to bolster the markets at that particular time.
Author

Nick Mastrandrea
Market Tea Leaves


