Mixed signals: Navigating a disconnected market

USD: Sept '25 is Up at 97.425.
Energies: Aug '25 Crude is Up at 66.96.
Financials: The Sep '25 30 Year T-Bond is Lower by 20 ticks and trading at 113.20.
Indices: The Jun '25 S&P 500 emini ES contract is 170 ticks Lower and trading at 6282.00.
Gold: The Aug'25 Gold contract is trading Up at 3358.80.
Initial conclusion
This is not a correlated market. The USD is Up and Crude is Up which is not normal, and the 30 Year T-Bond is trading Lower. The Financials should always correlate with the US dollar such that if the dollar is Higher, then the bonds should follow and vice-versa. The S&P is Lower and Crude is trading Higher which is correlated. Gold is trading Higher which is not correlated with the US dollar trading Up. I tend to believe that Gold has an inverse relationship with the US Dollar as when the US Dollar is down, Gold tends to rise in value and vice-versa. Think of it as a seesaw, when one is up the other should be down. I point this out to you to make you aware that when we don't have a correlated market, it means something is wrong. As traders you need to be aware of this and proceed with your eyes wide open. Asia is Higher except the Nikkei and Sensex exchanges. Europe is Higher except the Milan and Spanish exchanges.
Possible challenges to traders
-
Federal Budget Balance is out at 2 PM EST. This is Major.
-
Lack of major economic news.
Traders, please note that we've changed the Bond instrument from the 10 Year (ZN) to the 2 Year (ZT). They work exactly the same.
We've elected to switch gears a bit and show correlation between the 2-year Treasury notes (ZT) and the S&P futures contract. The YM contract is the Dow Jones Industrial Average, and the purpose is to show reverse correlation between the two instruments. Remember it's likened to a seesaw, when up goes up the other should go down and vice versa.
Yesterday the ZT dived Lower at around 8 AM EST with Unemployment Claims pending. The Dow leapt Higher at the same time. Look at the charts below and you'll see a pattern for both assets. The Dow dived Lower at 8:30 AM EST and the ZT climbed Higher at around the same time. These charts represent the newest version of Bar Charts, and I've changed the timeframe to a 15-minute chart to display better. This represented a Short opportunity on the 2-year note, as a trader you could have netted about a 20 plus ticks per contract on this trade. Each tick is worth $6.25. Please note: the front month for ZT is now Sep '25 and the Dow is now Sep '25. I've changed the format to filled Candlesticks (not hollow) such that it may be more apparent and visible.
Charts courtesy of BarCharts
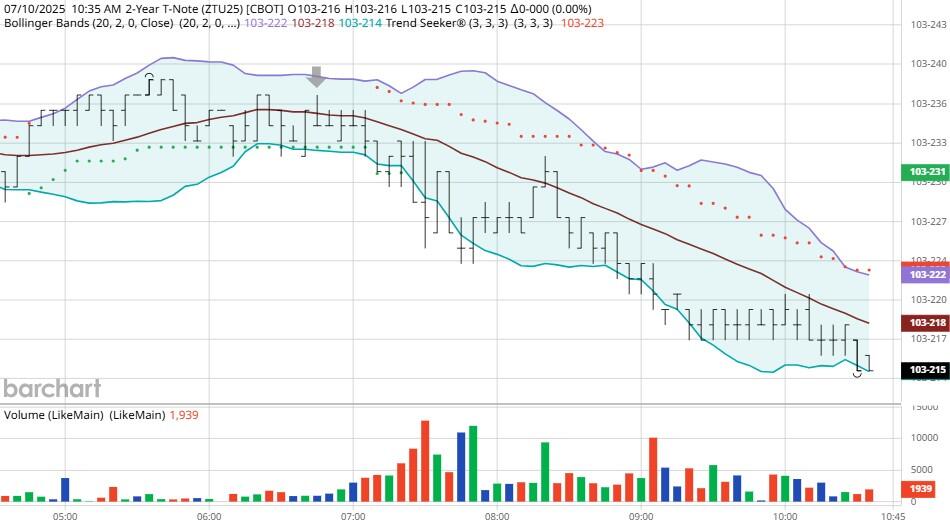
ZT -Sep 25 - 7/10/25
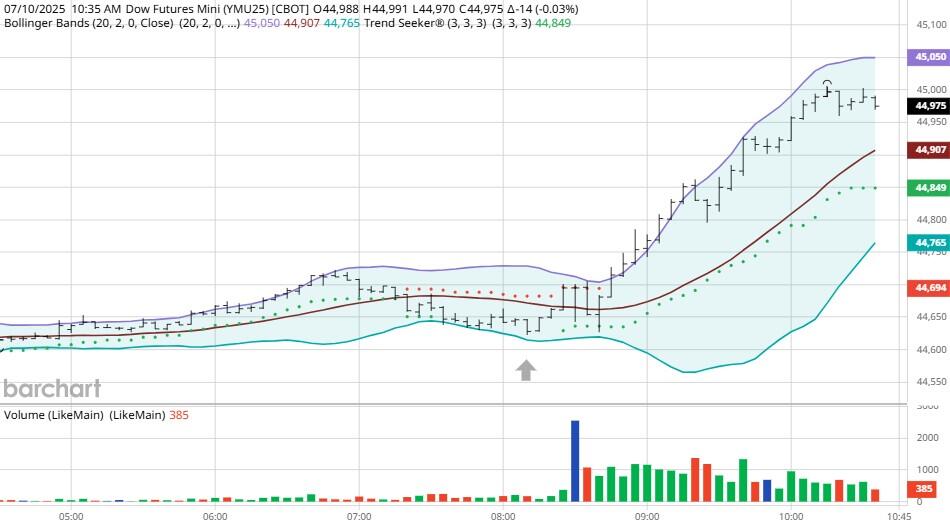
Dow - Sep 2025- 7/10/25
Bias
Yesterday we gave the markets a Neutral or Mixed bias and the markets didn't disappoint. The Dow and S&P closed Higher while the Nasdaq dived Lower. Today we aren't dealing with a correlated market, and our bias is to the Downside.
Could this change? Of Course. Remember anything can happen in a volatile market.
Commentary
Yesterday the markets were Mixed in the early AM hence the Neutral or Mixed bias. The markets closed Mixed with the Dow and S&P Higher but the Nasdaq Lower. Want to learn Market Correlation and determine market direction hours before the Opening Bell?
Author

Nick Mastrandrea
Market Tea Leaves


