Mixed markets again [Video]
![Mixed markets again [Video]](https://editorial.fxstreet.com/images/TechnicalAnalysis/Intermarket/Correlation/it-must-work-gm537868515-58464346.jpg)
US Dollar: Sept '21 USD is Up at 93.045.
Energies: Sept '21 Crude is Up at 67.39.
Financials: The Sept '21 30 Year bond is Down 2 ticks and trading at 163.20.
Indices: The Sept '21 S&P 500 emini ES contract is 2 ticks Lower and trading at 4425.00.
Gold: The Aug'21 Gold contract is trading Up at 1737.70. Gold is 38 ticks Higher than its close.
Initial conclusion
This is not a correlated market. The dollar is Up and Crude is Up which is not normal but the 30 year Bond is trading Lower. The Financials should always correlate with the US dollar such that if the dollar is lower then bonds should follow and vice-versa. The S&P is Lower and Crude is trading Higher which is correlated. Gold is trading Higher which is not correlated with the US dollar trading Up. I tend to believe that Gold has an inverse relationship with the US Dollar as when the US Dollar is down, Gold tends to rise in value and vice-versa. Think of it as a seesaw, when one is up the other should be down. I point this out to you to make you aware that when we don't have a correlated market, it means something is wrong. As traders, you need to be aware of this and proceed with your eyes wide open. All of Asia is trading Higher at the present time. Currently, Europe is trading Mixed.
Possible challenges to traders today
-
NFIB Small Business Index is out at 6 AM EST. This is Major.
-
Prelim Nonfarm Productivity q/q is out at 8:30 AM EST. This is Major.
-
Prelim Unit Labor Costs q/q is out at 8:30 AM EST. This is Major.
-
Mortgage Delinquencies. This is Major.
Treasuries
Traders please note that we've changed the Bond instrument from the 30 years (ZB) to the 10 years (ZN). They work exactly the same.
We've elected to switch gears a bit and show a correlation between the 10-year bond (ZN) and The S&P futures contract. The S&P contract is the Standard and Poor's and the purpose is to show reverse correlation between the two instruments. Remember it's likened to a seesaw, when up goes up the other should go down and vice versa.
Yesterday the ZN made its move at around 9:45 AM EST. The ZN hit a High at around that time and the S&P moved Higher. If you look at the charts below ZN gave a signal at around 9:45 AM EST and the S&P moved Higher at around the same time. Look at the charts below and you'll see a pattern for both assets. ZN hit a High at around 9:45 AM EST and the S&P was moving Higher shortly thereafter. These charts represent the newest version of MultiCharts and I've changed the timeframe to a 15-minute chart to display better. This represented a Shorting opportunity on the 10-year note, as a trader you could have netted about 25 ticks per contract on this trade. Each tick is worth $15.625. Please note: the front month for the ZN is now Sept '21. The S&P contract is also Sept '21. I've changed the format to Renko bars such that it may be more apparent and visible.
Charts Courtesy of MultiCharts built on an AMP platform
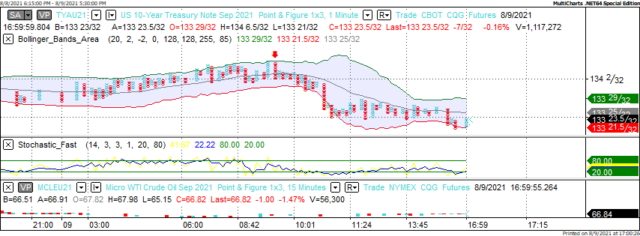
ZN - Sept 2021 - 8/09/21
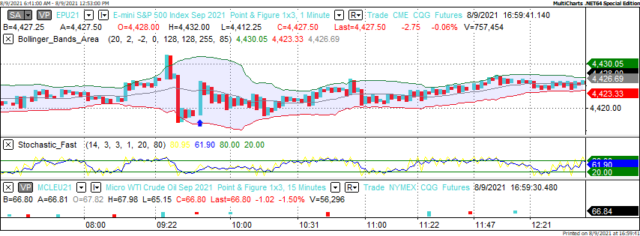
S&P - Sept 2021 - 8/09/21
Bias
Yesterday we gave the markets a Neutral or Mixed bias as we saw no evidence of Market Correlation Monday morning. The markets didn't disappoint as the Dow traded lower by 107 points, the S&P traded 4 points Lower and the Nasdaq closed 24 points higher. Today we aren't dealing with a correlated market and our bias is to the Downside.
Could this change? Of Course. Remember anything can happen in a volatile market.
Commentary
Once again yesterday we witness Neutral or Mixed markets as Monday morning we saw no evidence of market correlation at all hence the Neutral or Mixed bias. Remember that a Mixed bias means the markets could go anywhere and they did. The good news was Jobs Openings handily beat expectations by coming in at 10.7 Million versus 9.27 Million expected. The Labor market is improving and gaining steam and this is always positive. Today we have preliminary Productivity and Unit Labor Costs. Given that these numbers are preliminary there is always greater weight associated with preliminary as opposed to revised.
Author

Nick Mastrandrea
Market Tea Leaves
Nick Mastrandrea over 20 years experience in trading and formerly held a NASD Series 7. He currently holds a NJ Life, Health and Variable Authority. Nick is a published writer and his work has appeared in Futures Magazine, TraderPlanet and others.


