Mixed market doesn’t disappoint

USD: Mar '24 is Up at 102.840.
Energies: Apr '24 Crude is Up at 80.34.
Financials: The June '24 30 Year T-Bond is Up 4 ticks and trading at 120.12.
Indices: The Mar '24 S&P 500 emini ES contract is 68 ticks Higher and trading at 5249.50.
Gold: The Apr'24 Gold contract is trading Down at 2175.00
Initial conclusion
This is not a correlated market. The USD is Up and Crude is Up which is not normal, and the 30 Year T-Bond is trading Higher. The Financials should always correlate with the US dollar such that if the dollar is Higher, then the bonds should follow and vice-versa. The S&P is Higher and Crude is trading Higher which is not correlated. Gold is trading Higher which is correlated with the US dollar trading Down. I tend to believe that Gold has an inverse relationship with the US Dollar as when the US Dollar is down, Gold tends to rise in value and vice-versa. Think of it as a seesaw, when one is up the other should be down. I point this out to you to make you aware that when we don't have a correlated market, it means something is wrong. As traders you need to be aware of this and proceed with your eyes wide open. Asia is trading Mixed with half the exchanges Higher and the other half Lower. Currently all of Europe is trading Higher with the exception of the London exchange which is Lower.
Possible challenges to traders
-
Core PPI m/m is out at 8:30 AM EST. This is Major.
-
PPI is out at 8:30 AM EST. This is Major.
-
Retail Sales m/m is out at 8:30 AM EST. This is Major.
-
Core Retail Sales m/m is out at 8:30 AM EST. This is Major.
-
Unemployment Claims are out at 8:30 AM EST. This is Major.
-
Business Inventories m/m is out at 10 AM EST. This is Major.
-
Natural Gas Storage is out at 10:30 AM EST. This is Major.
Treasuries
Traders, please note that we've changed the Bond instrument from the 30 year (ZB) to the 10 year (ZN). They work exactly the same.
We've elected to switch gears a bit and show correlation between the 10-year bond (ZN) and the S&P futures contract. The S&P contract is the Standard and Poor's, and the purpose is to show reverse correlation between the two instruments. Remember it's likened to a seesaw, when up goes up the other should go down and vice versa.
Yesterday the ZN migrated Lower at around 10:40 AM EST as the S&P hit a Low at around the same time. If you look at the charts below the S&P gave a signal at around 10:40 AM and the ZN started its Downward slide. Look at the charts below and you'll see a pattern for both assets. S&P hit a Low at around 10:40 AM and migrated Higher. These charts represent the newest version of MultiCharts and I've changed the timeframe to a 15-minute chart to display better. This represented a Short opportunity on the 10-year note, as a trader you could have netted about a dozen ticks per contract on this trade. Each tick is worth $15.625. Please note: the front month for the ZN is now Jun '24. The S&P contract is still Mar' 24. I've changed the format to filled Candlesticks (not hollow) such that it may be more apparent and visible.
Charts courtesy of MultiCharts built on an AMP platform
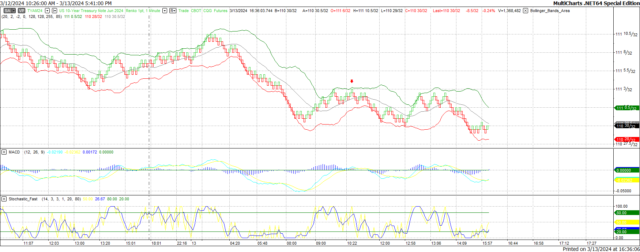
ZN -Jun 2024 - 03/13/24
-638460145718864518.png)
S&P - Mar 2024 - 03/13/24
Bias
Yesterday we gave the markets a Neutral or Mixed bias as we didn't see much in the way of market correlation Wednesday morning. The markets didn't disappoint as the Dow traded Higher by 38 points, but the S&P and Nasdaq both traded Lower. Today we aren't dealing with a correlated market and our bias is Neutral.
Could this change? Of Course. Remember anything can happen in a volatile market.
Commentary
Yesterday we didn't have much to drive the markets as the economic news was sparse at best. From our perspective we relied on our rules of Market Correlation which told us it would be a Mixed or Neutral Day. At the end of the day, it was a Mixed or Neutral Day. Today we have far more news to drive the markets. PPI, Retail Sales and Unemployment Claims can all drive the markets in one direction or another. Time will tell in what direction it will drive us.
Author

Nick Mastrandrea
Market Tea Leaves


