Mixed Expectations, Will Stocks Continue Higher?

Briefly:
Intraday trade: Our Friday's neutral intraday outlook has proved accurate. The S&P 500 index continued to fluctuate along the level of 2,500, as it remained close to new record high. The market may extend its short-term consolidation again. The support level is relatively close, at the September 12 daily gap up of 2,488.95-2,490.37. Therefore, we still prefer to be out of the market, avoiding low risk/reward ratio trades.
Our intraday outlook remains neutral, and our short-term outlook is bearish, as we expect downward correction. Our medium-term outlook remains bearish:
Intraday outlook (next 24 hours): neutral
Short-term outlook (next 1-2 weeks): bearish
Medium-term outlook (next 1-3 months): bearish
The main U.S. stock market indexes were mixed between -0.04% and +0.07% on Friday, as investors continued to hesitate following some economic data, quarterly corporate earnings releases. The S&P 500 index remained close to Wednesday's new record high of 2,508.85. It closed above 2,500 mark on Friday. The Dow Jones Industrial Average retraced some of its recent advance. However, it remained close to Thursday's new record high of 22,419.51. The technology Nasdaq Composite bounced off support level at 6,400. It closed around 0.8% below last Monday's new all-time high of 6,477.77. The nearest important level of resistance of the S&P 500 index remains at around 2,510. On the other hand, support level is at 2,490-2,500, marked by the September 12 daily gap up of 2,488.95-2,490.37, among others. The next support level remains at 2,465-2,475, marked by the September 11 daily gap up of 2,467.11-2,474.52. The level of support is also at 2,460, marked by previous short-term consolidation. The S&P 500 index continued its long-term uptrend, as it reached new record highs above the level of 2,500. It was gaining despite some short-term technical overbought conditions. We still can see medium-term negative technical divergences, but will they lead to a downward correction?
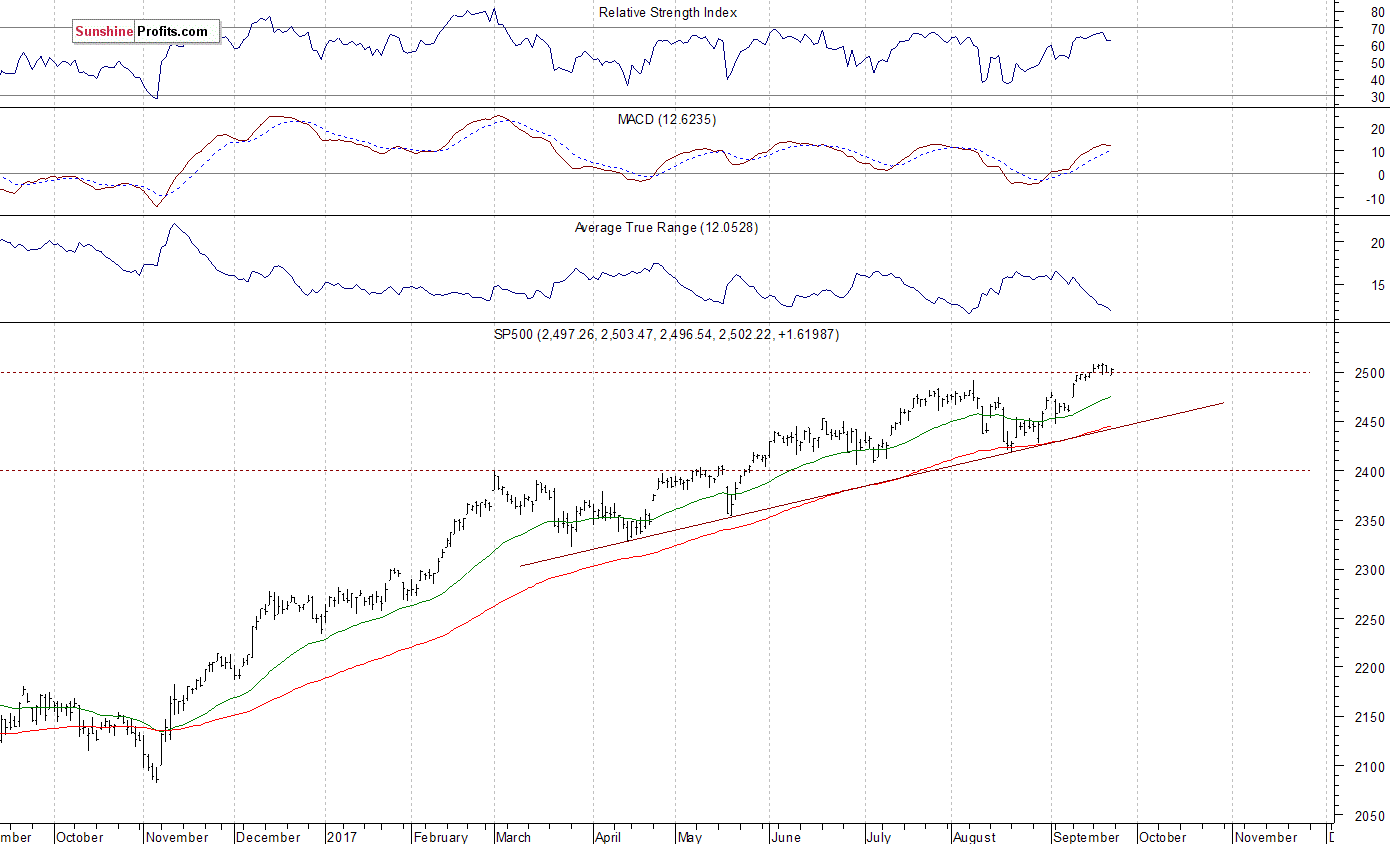
Still At 2,500 Mark
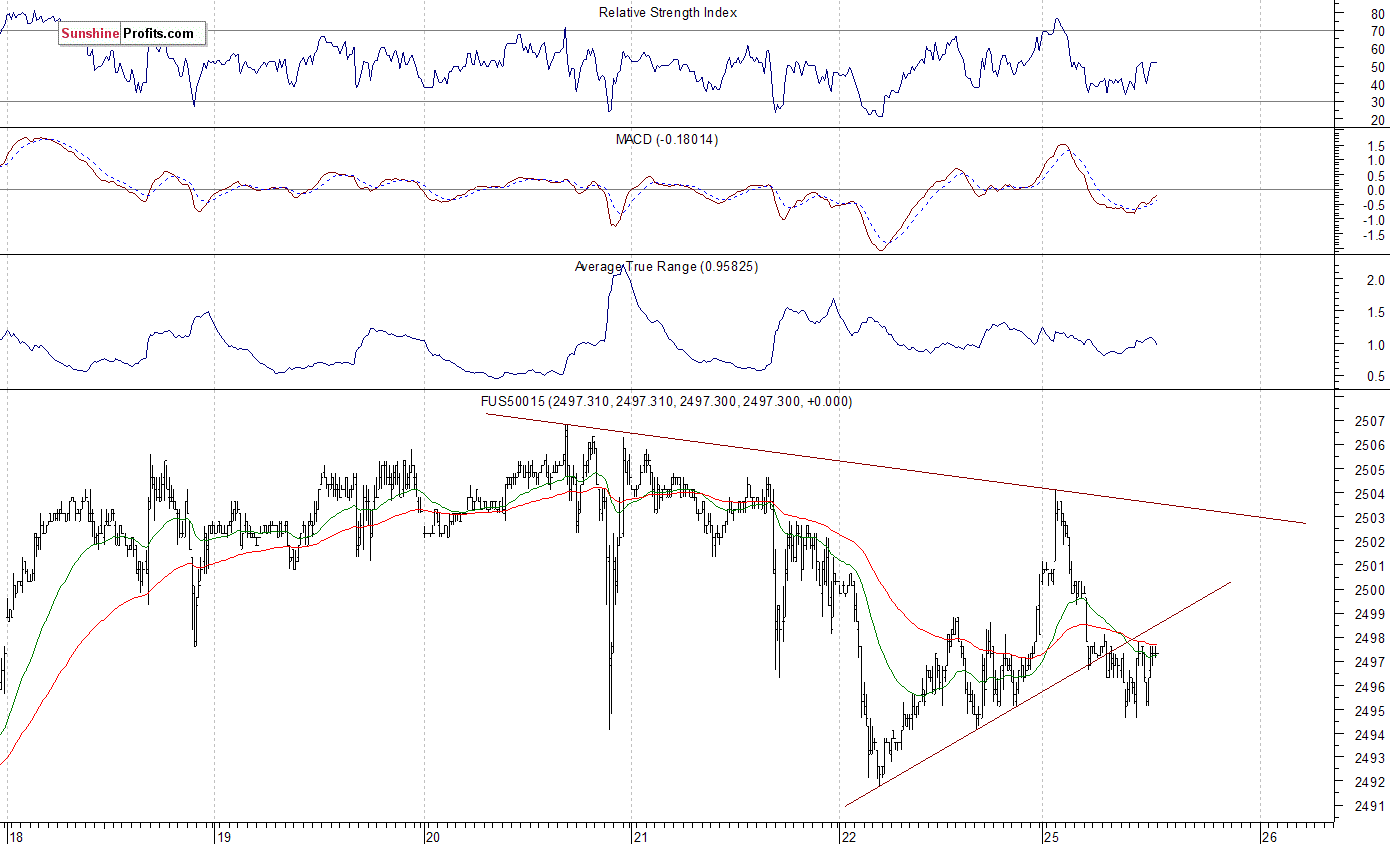
Expectations before the opening of today's trading session are virtually flat, with index futures currently down 0.1% vs. their Friday's closing prices. The European stock market indexes have been mixed so far. There will be no new important economic data releases today. However, the market will wait for some FOMC's Members speeches today. The S&P 500 futures contract trades within an intraday consolidation following overnight move down. The nearest important level of resistance is at around 2,500-2,510. On the other hand, support level remains at 2,490, marked by previous level of resistance. The next support level is at 2,480-2,485, marked by short-term consolidation. The support level is also at 2,465-2,470, among others. The futures contract trades below its two-day-long upward trend line, however, it remains within a short-term consolidation, as we can see on the 15-minute chart:
Nasdaq Relatively Weaker
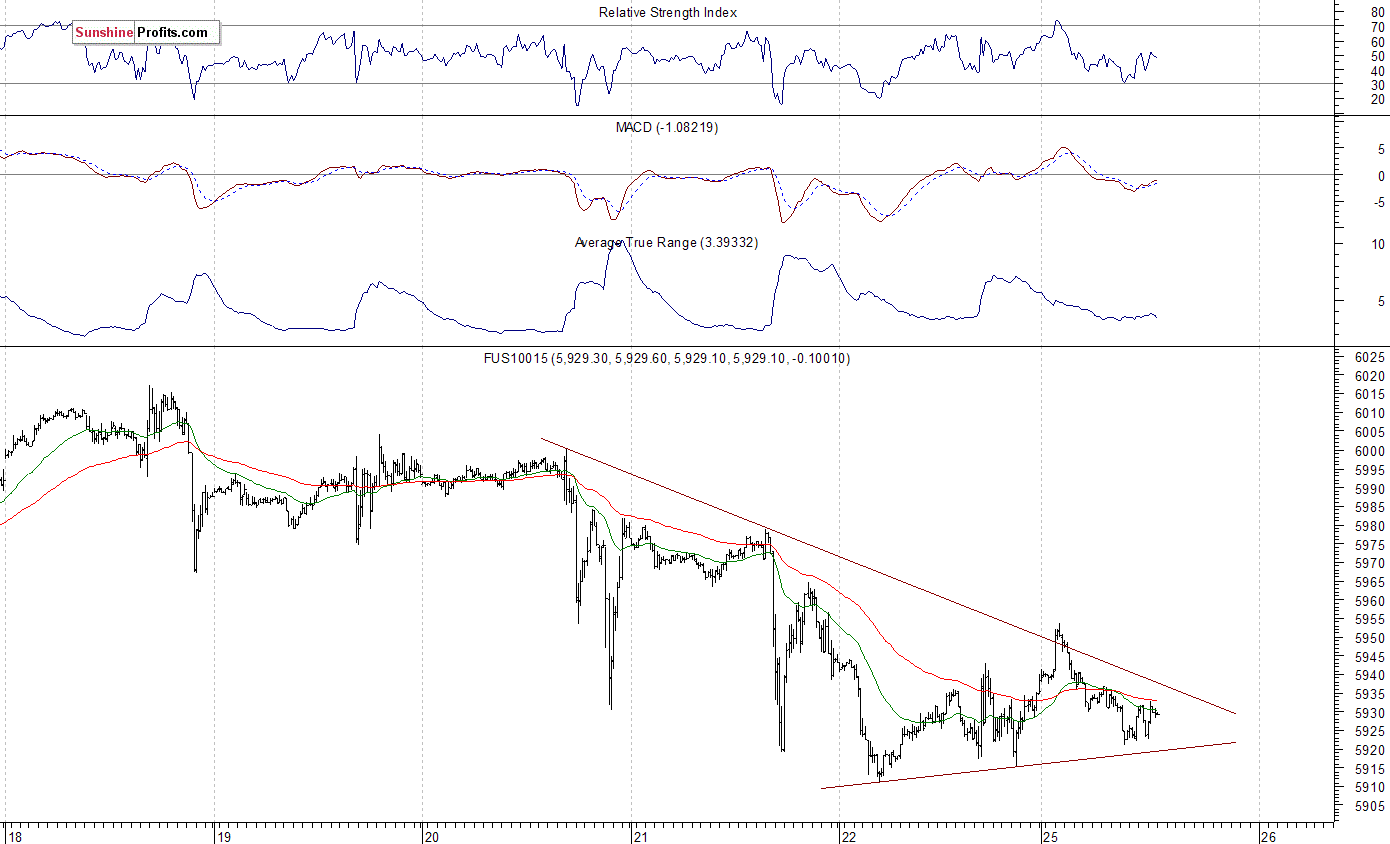
The technology Nasdaq 100 futures contract follows a similar path, as it trades within an intraday consolidation following overnight move down. The nearest important level of resistance is at around 5,950, marked by short-term local highs. The next resistance level is at 5,980-6,000, marked by short-term consolidation. On the other hand, level of support is at 5,900, marked by Friday's overnight low, among others. The Nasdaq futures contract fluctuates following its recent move down, as the 15-minute chart shows:
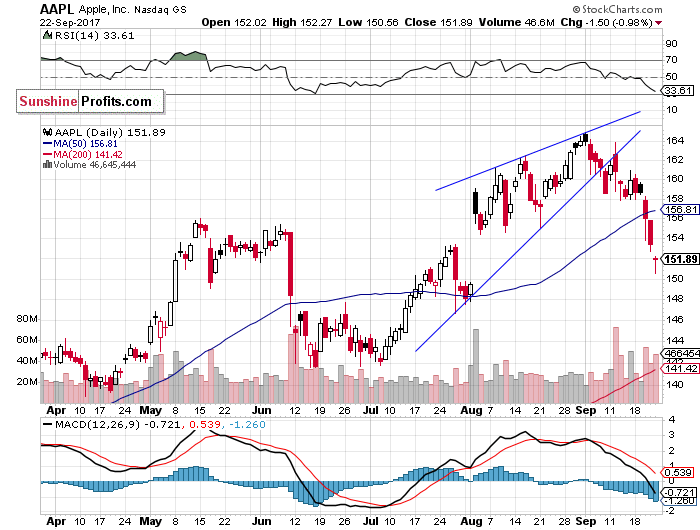
Let's take a look at Apple, Inc. stock (AAPL) daily chart again. It continued its short-term downtrend on Friday, following breakout below recent consolidation. The stock continues to trade below previously broken upward trend line and below its over-month-long rising wedge pattern. We still can see relative weakness vs. the broad stock market index. The price is close to support level of the early August daily gap up:
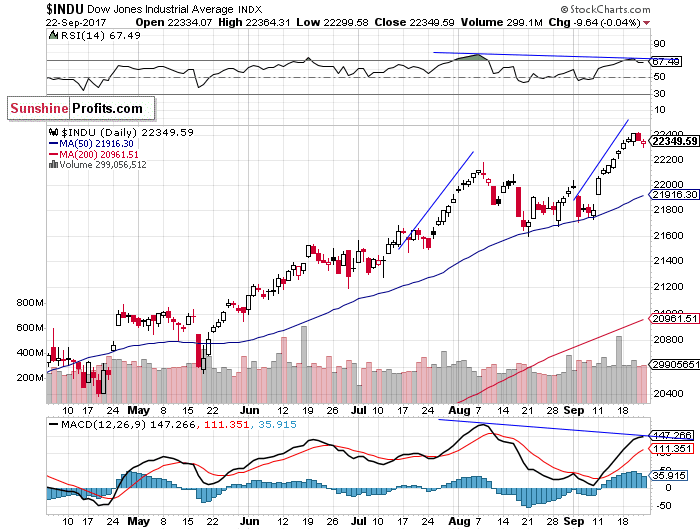
Now, let's take a look at the Dow Jones Industrial Average daily chart. The blue-chip index retraced some of its recent move up, as it got away from Thursday's new record high. It was relatively stronger than the broad stock market recently. Is this an uptrend reversal? We can see some negative technical divergences, along with topping pattern:
Concluding, the S&P 500 index gained around 0.1% on Friday, as it continued to fluctuate within a short-term consolidation. Is this a topping pattern or just another flat correction within an uptrend? Will the broad stock market retrace more of its September advance? We still can see medium-term overbought conditions along with negative technical divergences.
Want free follow-ups to the above article and details not available to 99%+ investors? Sign up to our free newsletter today!
Author

Paul Rejczak
Sunshine Profits
Paul Rejczak is a stock market strategist who has been known for the quality of his technical and fundamental analysis since the late nineties.


