Tariff turmoil and Putin’s game: Trump’s hard-learned lessons

USD: Sept '25 is Down at 98.225.
Energies: Aug '25 Crude is Down at 65.02.
Financials: The Sep '25 30 Year T-Bond is Higher by 7 ticks and trading at 112.06.
Indices: The Sep '25 S&P 500 emini ES contract is 12 ticks Lower and trading at 6281.00.
Gold: The Aug'25 Gold contract is trading Up at 3342.30.
Initial conclusion
This is not a correlated market. The USD is Down and Crude is Down which is not normal, and the 30 Year T-Bond is trading Higher. The Financials should always correlate with the US dollar such that if the dollar is Higher, then the bonds should follow and vice-versa. The S&P is Lower and Crude is trading Lower which is not correlated. Gold is trading Higher which is correlated with the US dollar trading Down. I tend to believe that Gold has an inverse relationship with the US Dollar as when the US Dollar is down, Gold tends to rise in value and vice-versa. Think of it as a seesaw, when one is up the other should be down. I point this out to you to make you aware that when we don't have a correlated market, it means something is wrong. As traders you need to be aware of this and proceed with your eyes wide open. Asia traded mainly Higher with the exception of the Aussie and Shanghai exchanges. All of Europe is trading Higher.
Possible challenges to traders
-
FOMC Member Barkin Speaks at 8 AM EST. This is Major.
-
Core PPI m/m is out at 8:30 AM EST. This is Major.
-
PPI m/m is out at 8:30 AM EST. This is Major.
-
Capacity Utilization Rate is out at 9:15 AM EST. This is Major.
-
FOMC Member Hammack Speaks at 9:15 AM EST. This is Major.
-
Industrial Production m/m is out at 9:15 AM EST. This is Major.
-
FOMC Member Barr Speaks at 10 AM EST. This is Major.
-
Crude Oil Inventories is out at 10:30 AM EST. This is Major.
-
Beige Book is out at 2 PM EST. This is Major.
Traders, please note that we've changed the Bond instrument from the 10 Year (ZN) to the 2 Year (ZT). They work exactly the same.
We've elected to switch gears a bit and show correlation between the 2-year Treasury notes (ZT) and the S&P futures contract. The YM contract is the Dow Jones Industrial Average, and the purpose is to show reverse correlation between the two instruments. Remember it's likened to a seesaw, when up goes up the other should go down and vice versa.
Yesterday the ZT dived Lower at around 8:30 AM EST with no eco news pending. The Dow leapt Higher at the same time. Look at the charts below and you'll see a pattern for both assets. The Dow climbed Higher at 8:30 AM EST and the ZT dived Lower at around the same time. These charts represent the newest version of Bar Charts, and I've changed the timeframe to a 15-minute chart to display better. This represented a Short opportunity on the 2-year note, as a trader you could have netted about 30 plus ticks per contract on this trade. Each tick is worth $6.25. Please note: the front month for ZT is now Sep '25 and the Dow is now Sep '25. I've changed the format to filled Candlesticks (not hollow) such that it may be more apparent and visible.
Charts courtesy of BarCharts
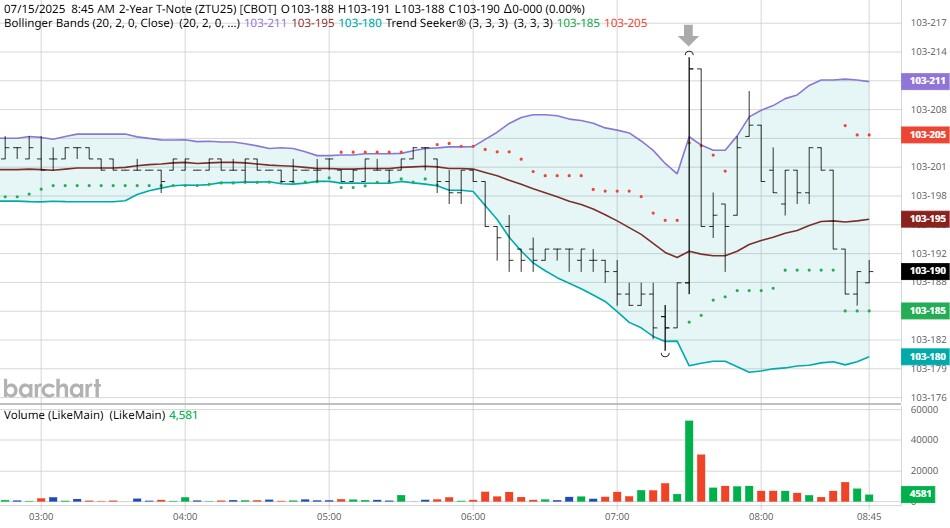
ZT -Sep 25 - 7/15/25
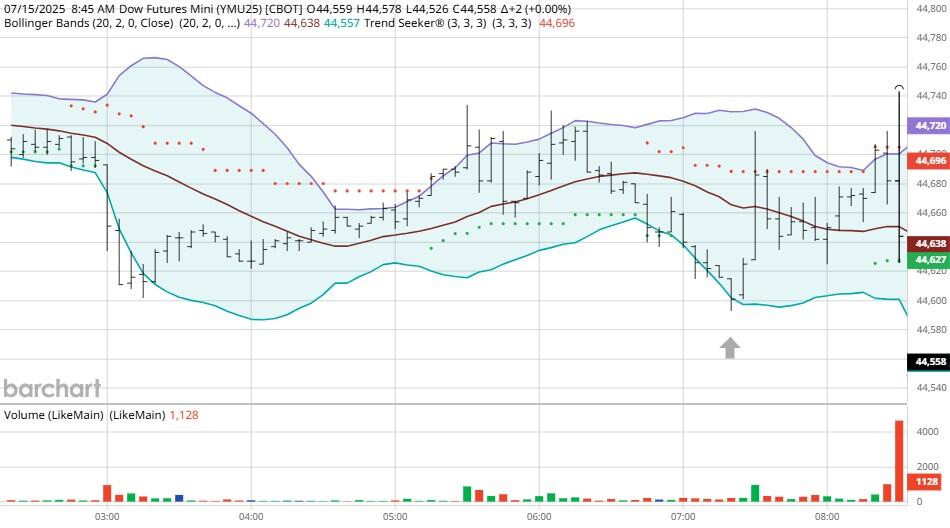
Dow - Sep 2025- 7/15/25
Bias
Yesterday we gave the markets a Neutral or Mixed bias and the markets didn't disappoint as the Dow dropped 164 points, but the S&P and Nasdaq both gained ground on the session. Today we aren't dealing with a correlated market, and our bias is Neutral or Mixed.
Could this change? Of Course. Remember anything can happen in a volatile market.
Commentary
It would seem that this administration is truly pushing its tariff agenda which continues to cause confusion in the markets. On another note, it would appear that Trump has finally come to the conclusion that Putin can't be trusted as he says one thing but does another. Hey, Prez, you should have listened to us and saved yourself some trouble, he wants the Ukraine back. Want to learn Market Correlation and determine market direction hours before the Opening Bell?
Author

Nick Mastrandrea
Market Tea Leaves


