Mixed bias – Down day

USD: Dec '24 is Up at 106.320.
Energies: Jan '25 Crude is Down at 67.96.
Financials: The Mar '25 30 Year T-Bond is Down 13 ticks and trading at 118.30.
Indices: The Dec '24 S&P 500 emini ES contract is 17 ticks Higher and trading at 6070.00.
Gold: The Feb'25 Gold contract is trading Up at 2694.40.
Initial conclusion
This is not a correlated market. The USD is Up and Crude is Down which is normal, but the 30 Year T-Bond is trading Lower. The Financials should always correlate with the US dollar such that if the dollar is Higher, then the bonds should follow and vice-versa. The S&P is Higher and Crude is trading Lower which is correlated. Gold is trading Higher which is not correlated with the US dollar trading Up. I tend to believe that Gold has an inverse relationship with the US Dollar as when the US Dollar is down, Gold tends to rise in value and vice-versa. Think of it as a seesaw, when one is up the other should be down. I point this out to you to make you aware that when we don't have a correlated market, it means something is wrong. As traders you need to be aware of this and proceed with your eyes wide open. Asia traded Mixed. Europe is trading mainly Lower with the exception of the German Dax.
Possible challenges to traders
-
NFIB Small Business Index is out at 6 AM EST. This is Major.
-
OPEC Meetings - All Day. This is Major.
-
Revised Nonfarm Productivity q/q is out at 8:30 AM EST. This is not Major.
-
Revised Unit Labor Costs q/q is out at 8:30 AM EST. This is not Major.
Traders, please note that we've changed the Bond instrument from the 10 year (ZN) to the 2 year (ZT). They work exactly the same.
We've elected to switch gears a bit and show correlation between the 2-year Treasury notes (ZT) and the S&P futures contract. The YM contract is the Dow Jones Industrial Average, and the purpose is to show reverse correlation between the two instruments. Remember it's likened to a seesaw, when up goes up the other should go down and vice versa.
Yesterday the ZT migrated Higher at around 8:30 AM EST with no economic news pending. The Dow migrated Lower at the same time. Look at the charts below and you'll see a pattern for both assets. The Dow moved Lower at 8:30 AM and the ZT moved Higher at around the same time. These charts represent the newest version of Bar Charts, and I've changed the timeframe to a 15-minute chart to display better. This represented a Long opportunity on the 2-year note, as a trader you could have netted about a dozen ticks per contract on this trade. Each tick is worth $7.625. Please note: the front month for ZT is now Mar '25 and the Dow is still Dec '24. I've changed the format to filled Candlesticks (not hollow) such that it may be more apparent and visible.
Charts courtesy of Barcharts
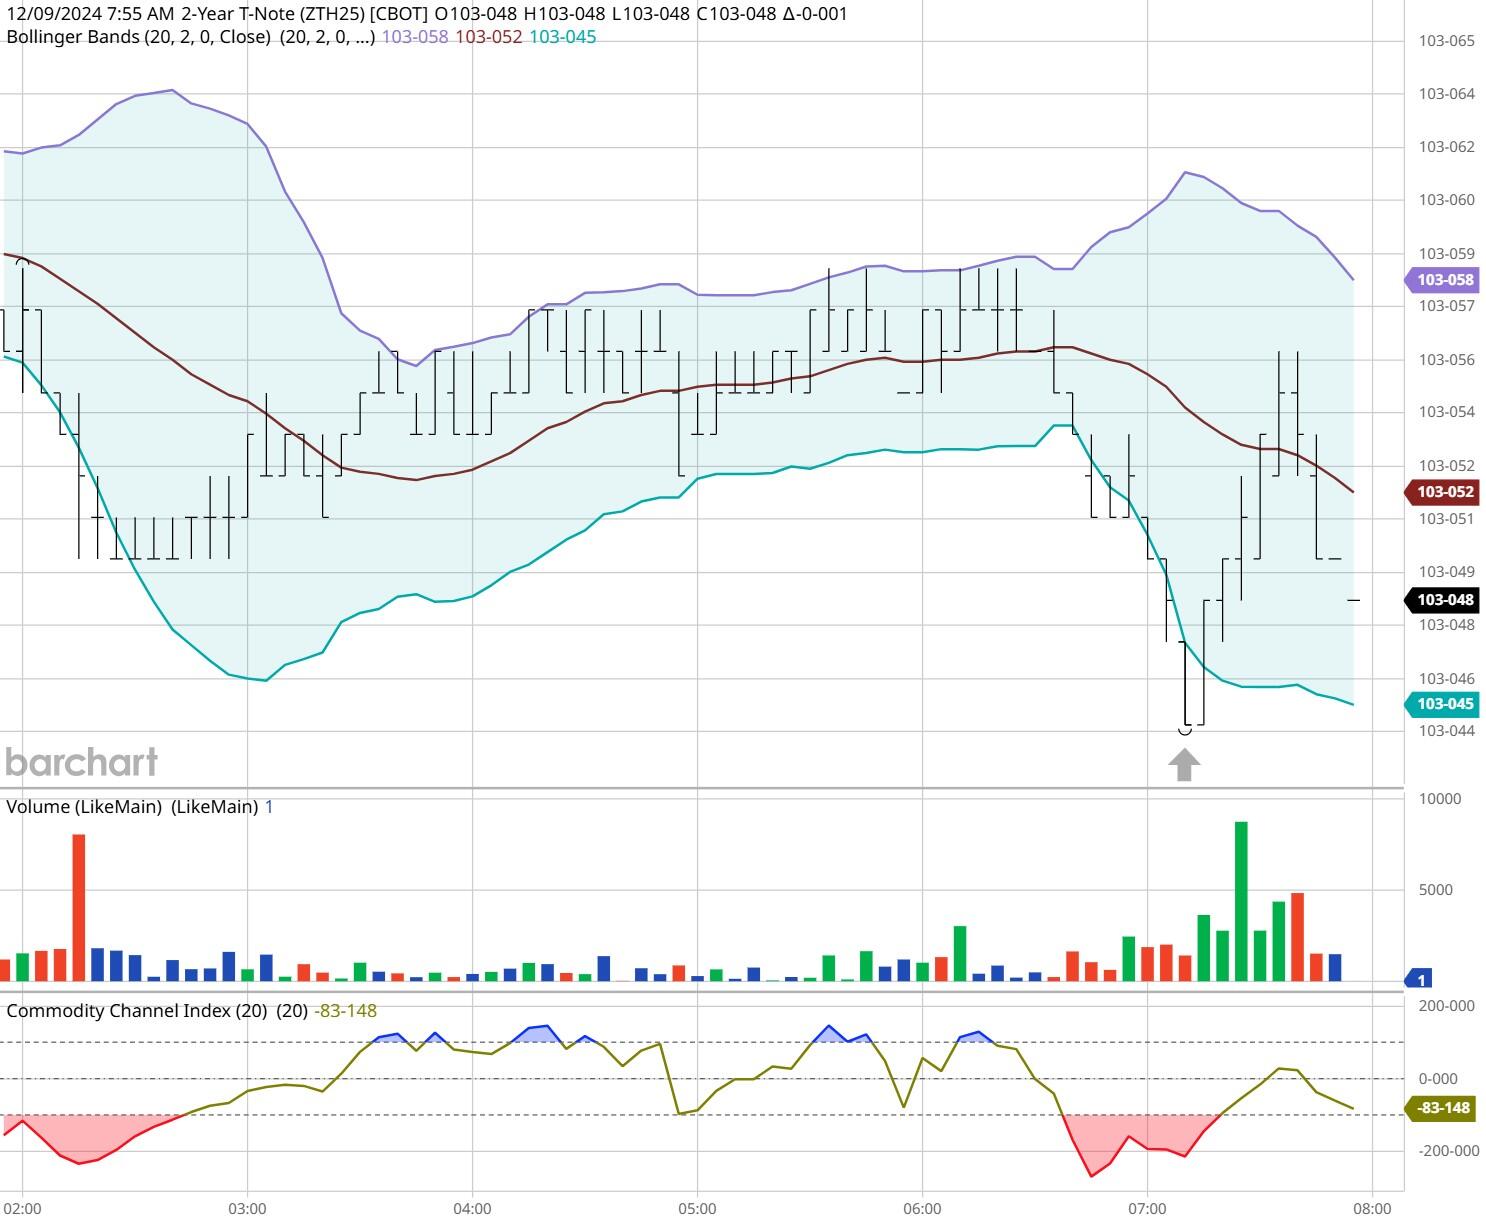
ZT -Mar 2025 - 12/09/24
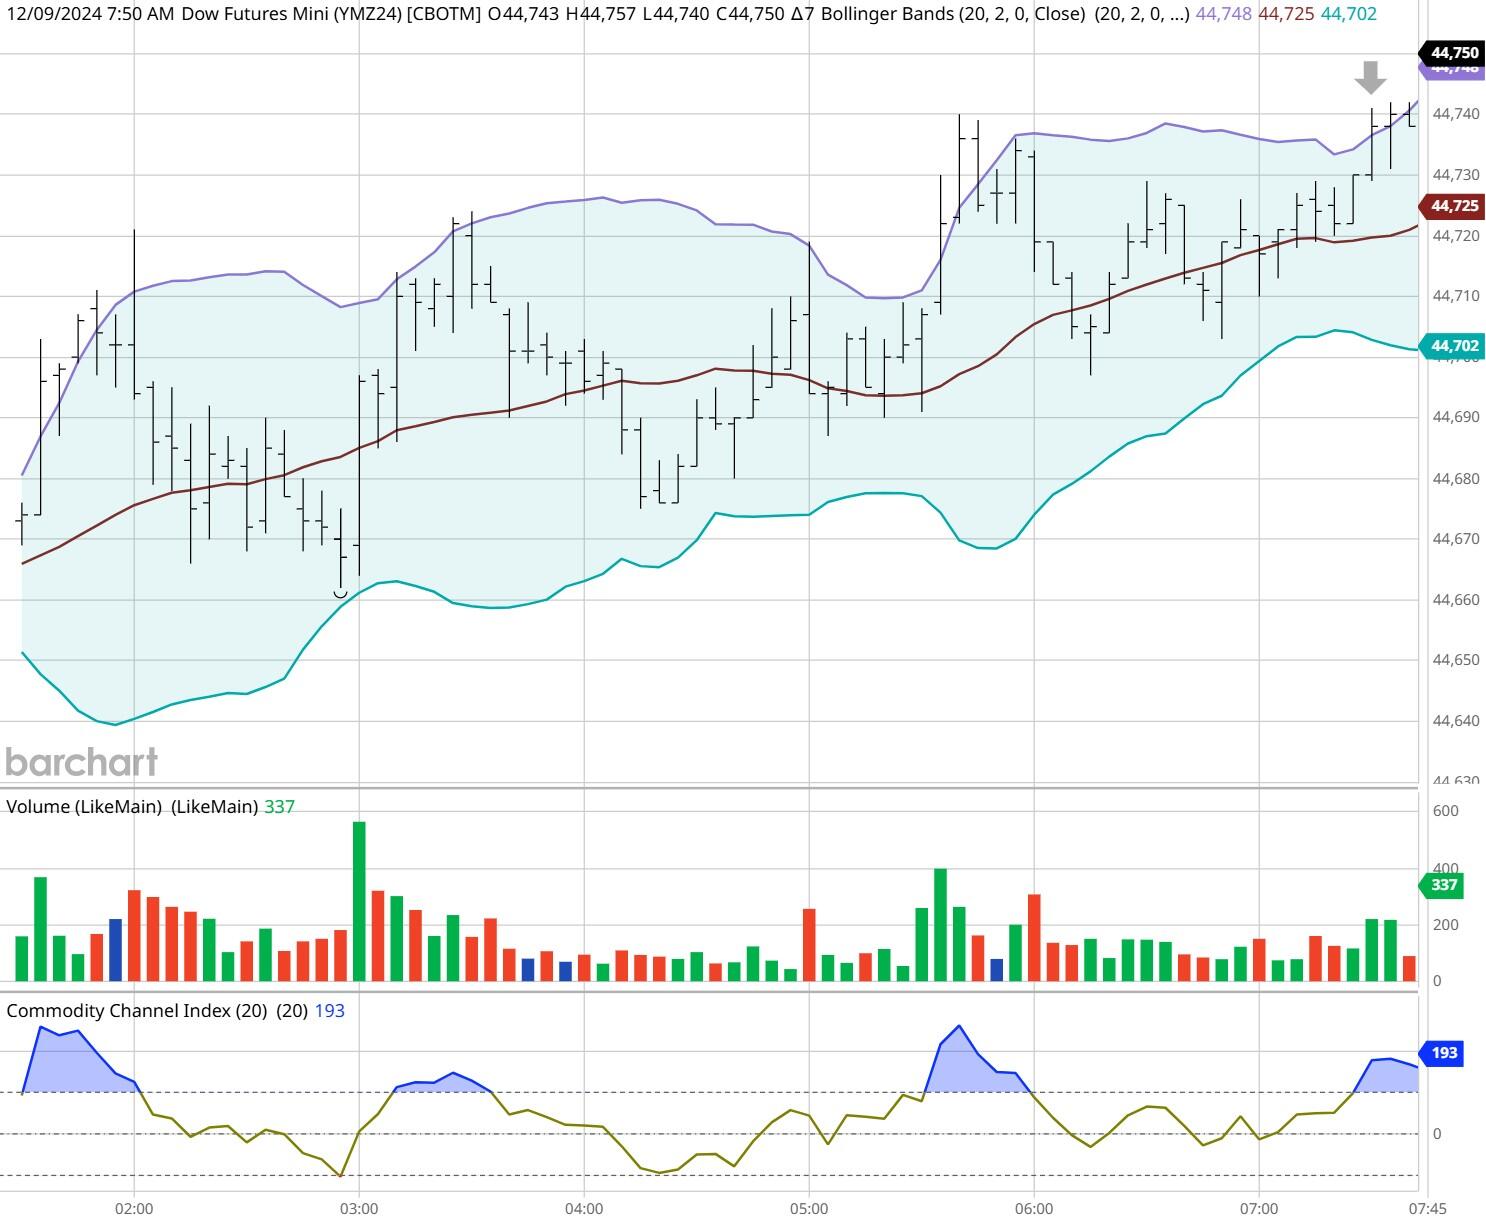
Dow - Dec 2024- 12/09/24
Bias
Yesterday we gave the markets a Mixed bias as we saw little evidence of Market Correlation Monday morning. The indices all traded Lower Monday with the Dow down 241 points and the other indices Lower as well. Today we aren't dealing with a correlated market, and our bias is Neutral or Mixed.
Could this change? Of Course. Remember anything can happen in a volatile market.
Commentary
Yesterday there was no economic news to drive the markets in one direction or another hence the Neutral or Mixed bias. The markets veered to the Downside will all indices closing Lower on Monday. Today we have Revised numbers and the all-important OPEC meeting. This meeting will determine what the OPEC nations will decide to do in 2015. Will they pump more oil to cut production? This could determine what the markets will be like in the very near future.
Author

Nick Mastrandrea
Market Tea Leaves


