Miners’ Rally? What Rally? Watch Out for More Fake Moves!

Remember how mining stocks soared on Valentine’s Day and how we wrote that a rally is not necessarily bullish? Guess what – this rally has been more than erased. Miners not only closed below the February 14th opening price, but also below the February 13th and 12th closing prices. Mining stocks big rally turned out to be nothing more than just a regular 50% retracement during a decline – something that we saw many times in the past and that we described as likely. But, since the rally was rather inconsequential, then perhaps the decline is inconsequential as well?
Not likely.
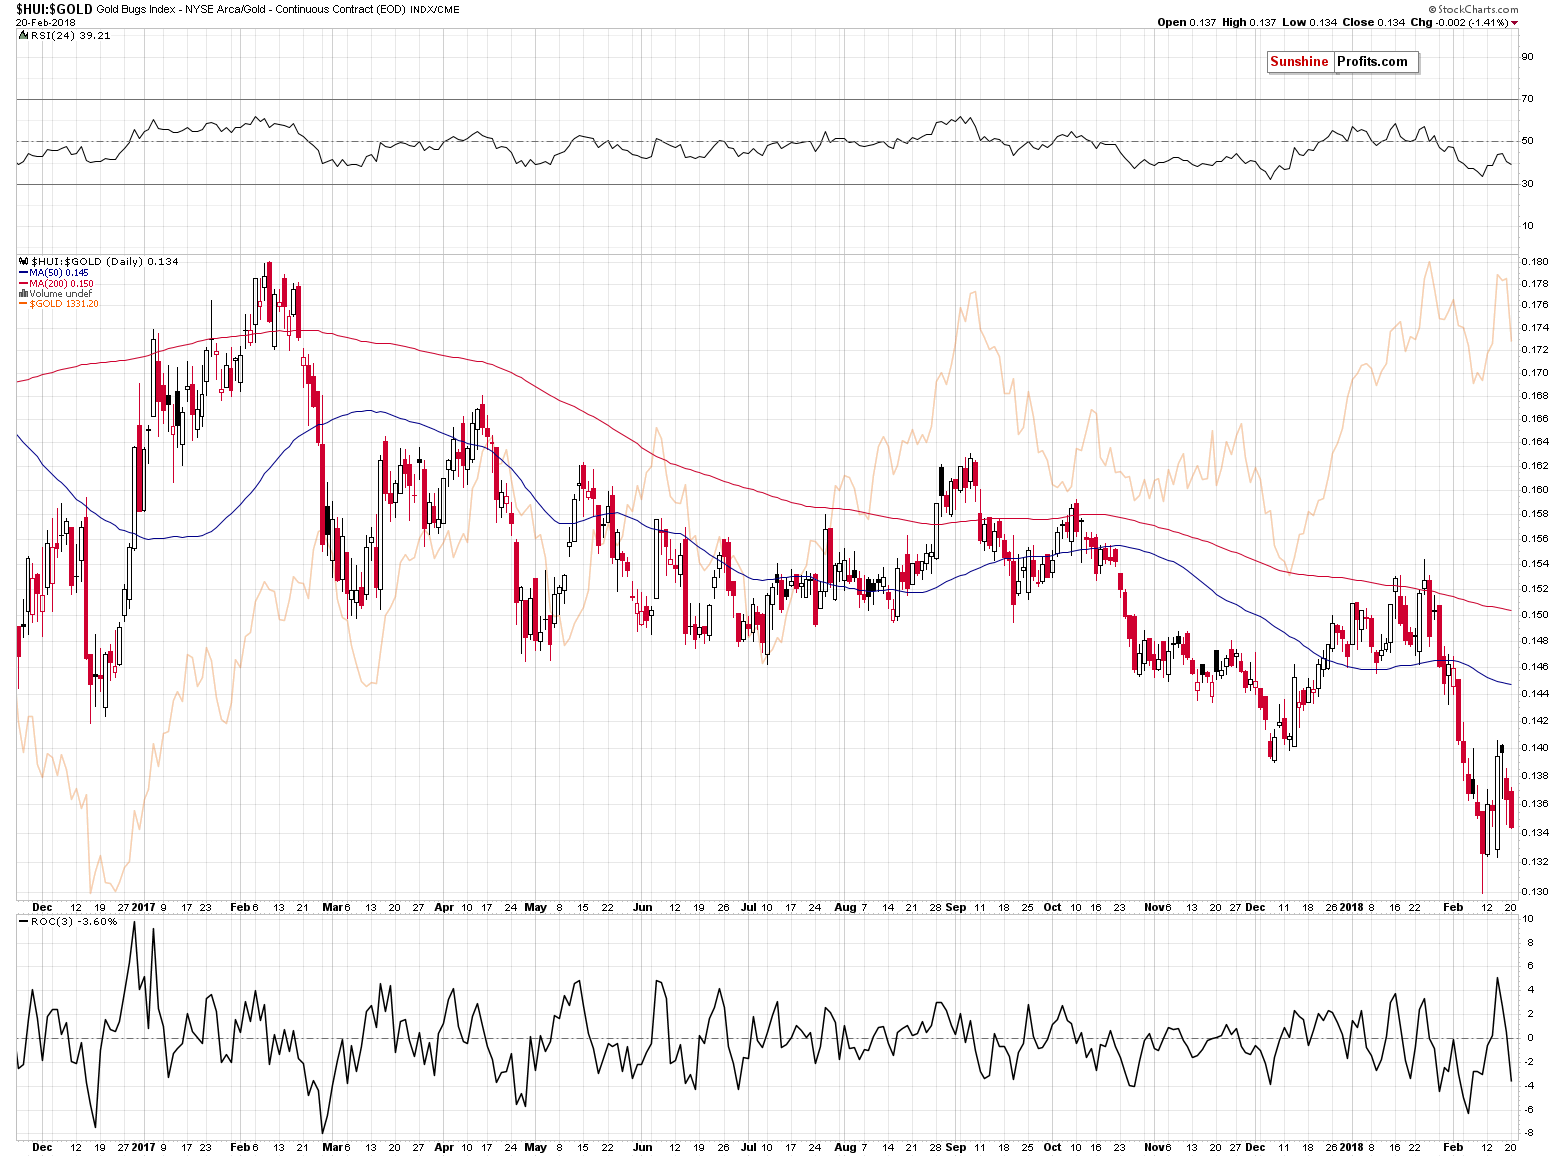
It’s not likely because of the context. Gold is still relatively close to its recent high, but mining stocks are very close to their recent low. The latter are underperforming, and Valentine’s Day rally was just a verification of the breakdown in the HUI to gold ratio. Let’s take a look at the details, starting with the currency market (charts courtesy of http://stockcharts.com).
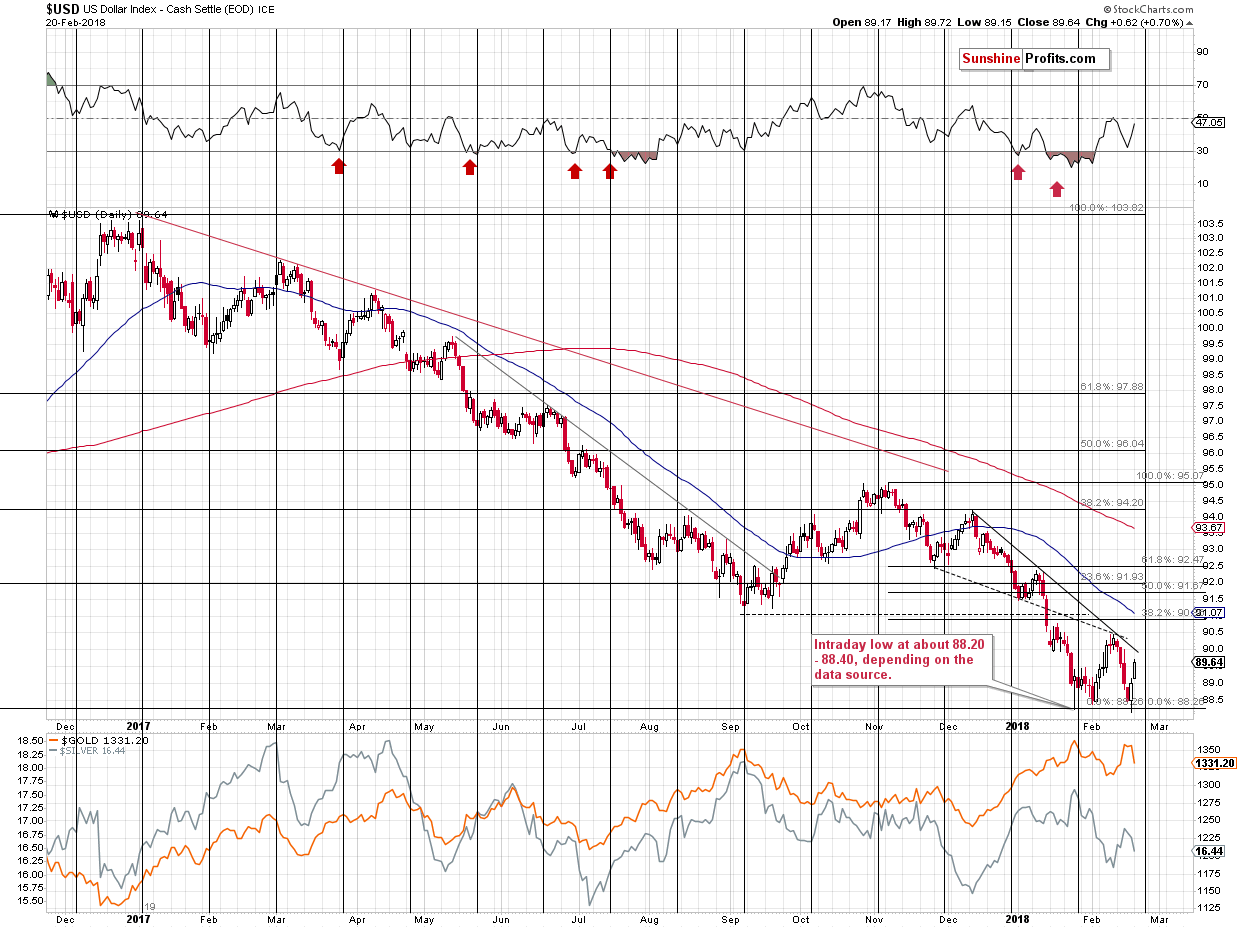
During Friday’s trading, The USD Index moved very insignificantly below the previous 2018 low and rallied back up, invalidating almost all breakdowns below important. support levels. The remaining breakdown was invalidated yesterday in a clear way, so the outlook improved further.
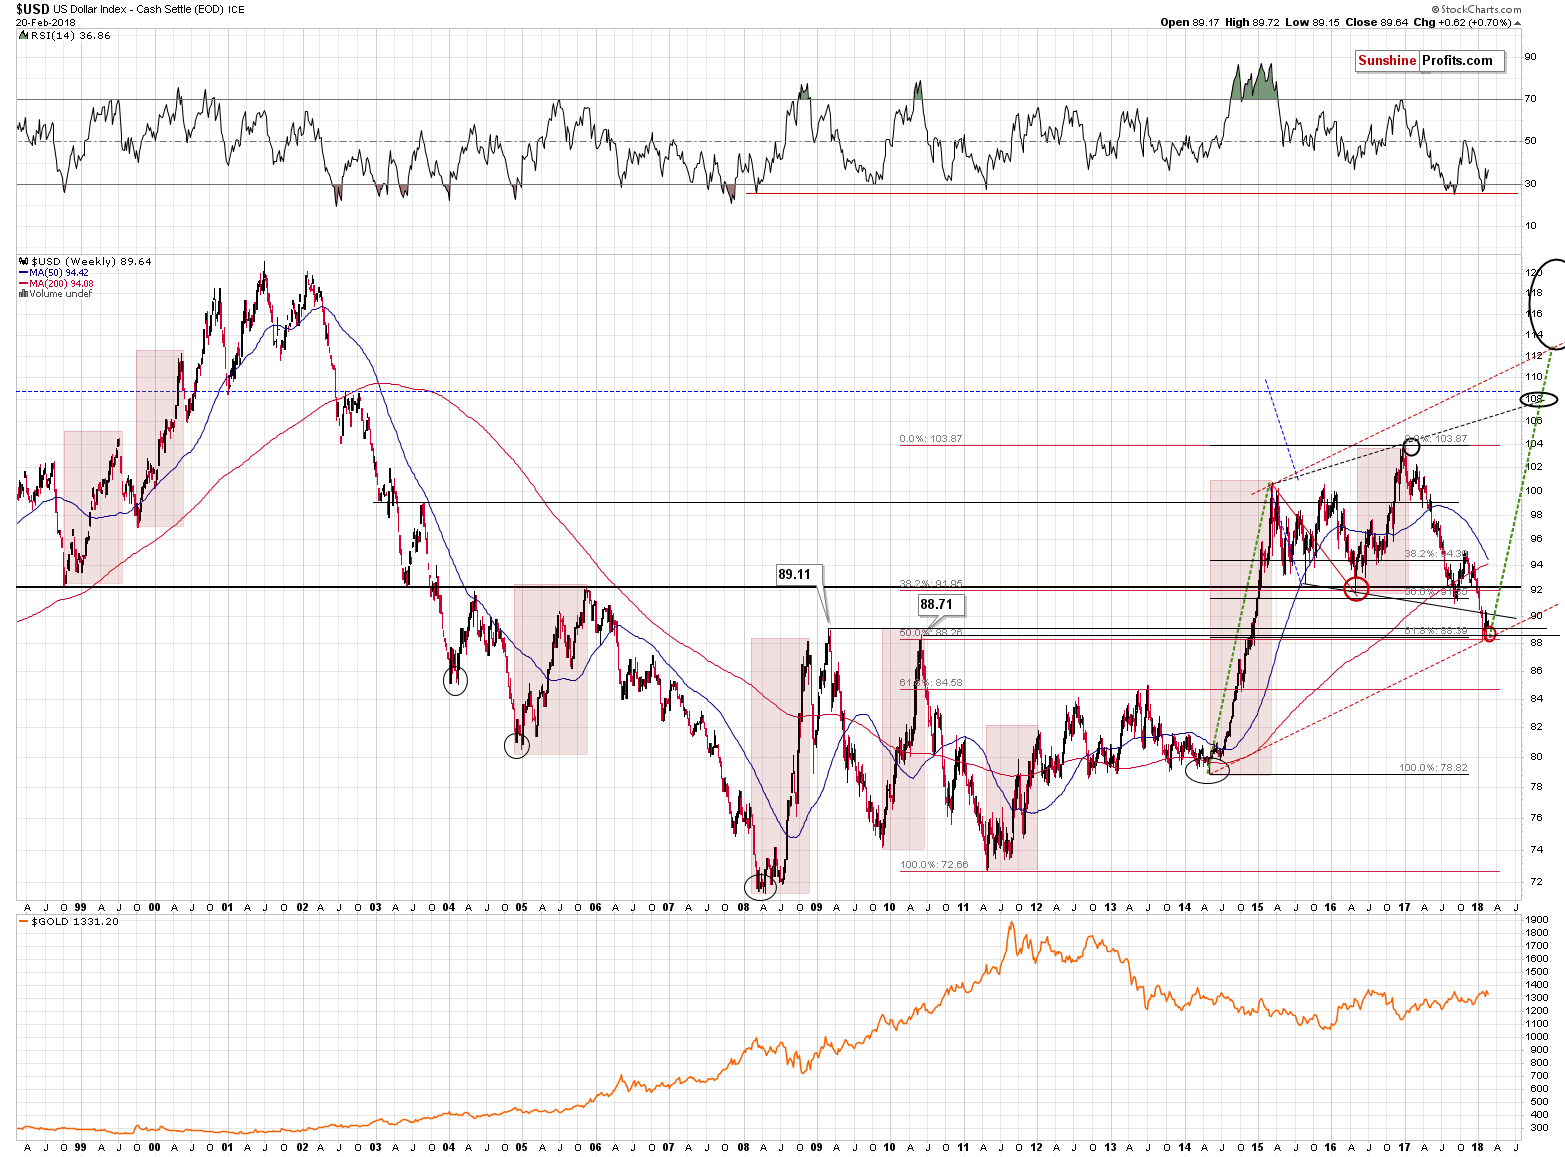
The chart above shows how significant the mentioned support levels actually are. Key tops and key Fibonacci retracements based on the key price extremes. Each of them is important and their combination is even more important. The same goes for the invalidation of breakdowns – the implications are bullish.
Please note that earlier this year the USD Index broke below the declining support / resistance line based on the mid-2015 and 2016 lows and this breakdown was verified recently. This is a bearish technical development, however, the combination of the 2009 and 2010 tops along with 2 major retracements based on major extremes (marked with red and black on the above chart) is much stronger than the above-mentioned declining line. The reason is that the mid-2015 and 2016 lows are less prominent than the 2009 and 2010 tops and the line based on the former is not strengthened by key Fibonacci retracements, while the latter is.
Consequently, the invalidation of breakdowns below the key, long-term support levels is far more important than the declining shorter-term line. That’s why all in all the outlook is bullish, but not bearish. At the moment of writing these words, the USD Index is trading at 89.82, so it’s very close to the above-mentioned line – it could even be the case that USD breaks decisively above 90 (the above-mentioned line is currently a bit above 90) later today. Actually, we hope that the 90 level doesn’t give up without a fight, but we expect that whether it happens shortly or in a week or so, the decisive breakout above 90 will be seen followed by a bigger rally.
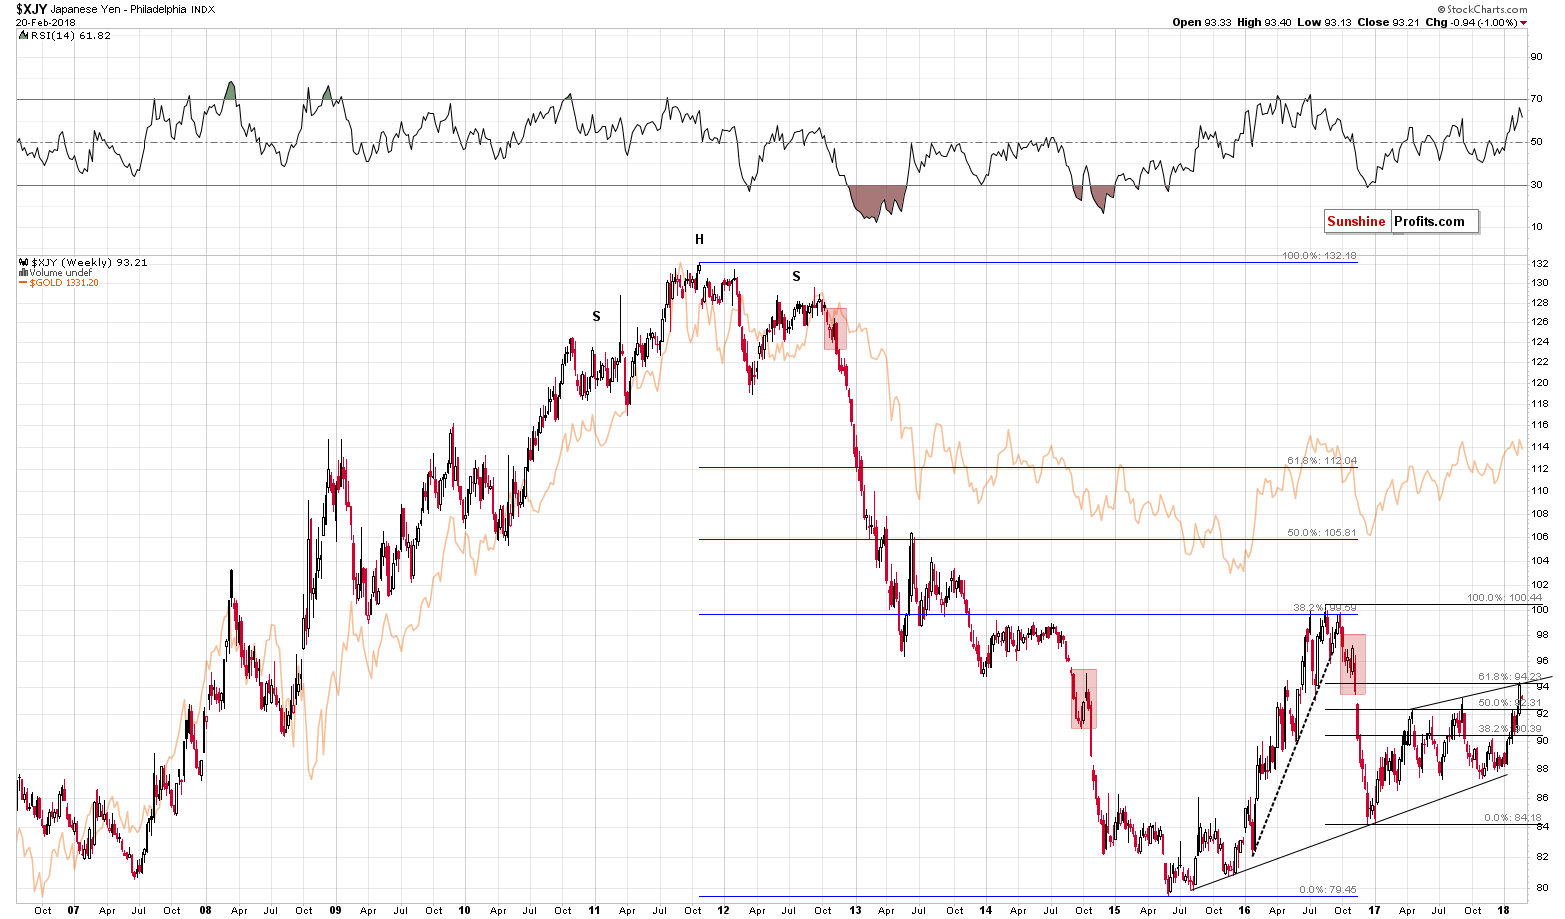
As we had indicated previously, it’s not just the entire USD Index’s picture that points to a reversal – one of its most important (the second most important) components is pointing to a reversal as well.
The Japanese yen reached a combination of strong resistance levels (rising medium-term resistance line and the 61.8% Fibonacci retracement level), which is quite likely to trigger a reversal. Knowing that the Japanese yen and gold very often move in tandem suggests that precious metals have just formed a major top – just like the yen probably did.
Speaking of precious metals, let’s take a look at gold.
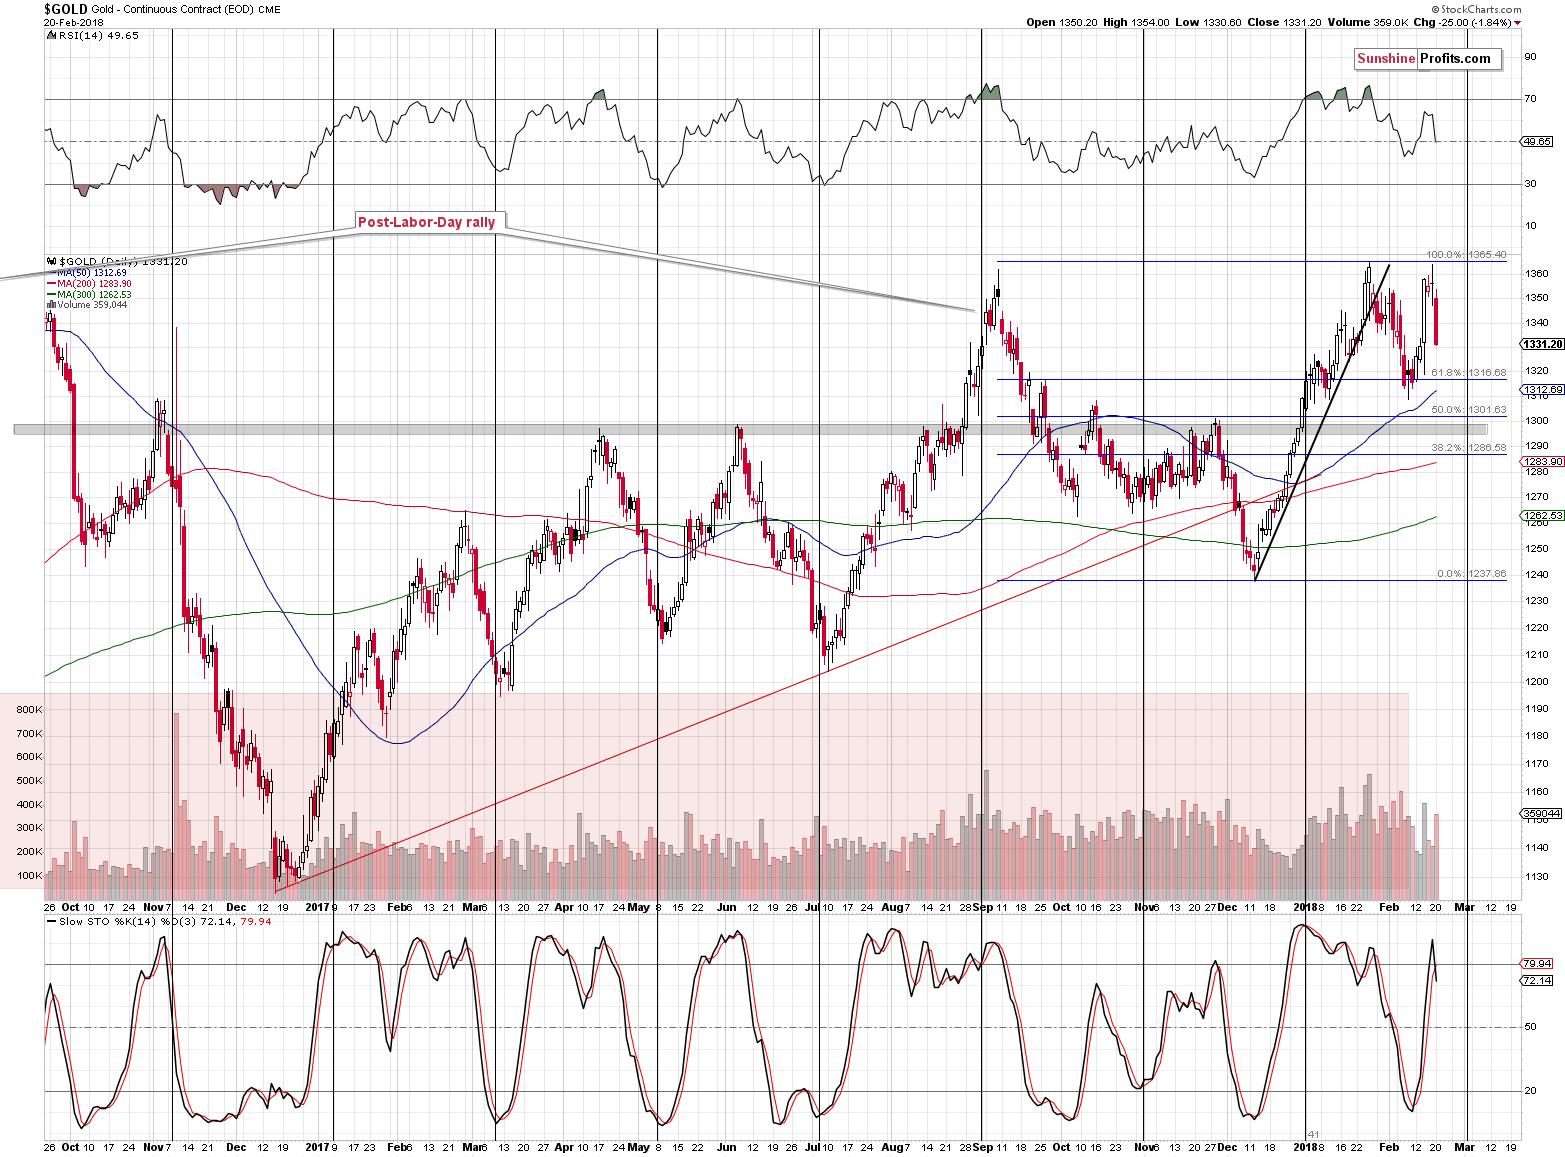
In the previous alerts, we warned that the previous move higher was not to be trusted. We also wrote that during the previous declines (the ones that started in September 2017 and January 2018), there was some back and forth movement close to the $1,335 in both cases, so we might also see the same here. If we indeed see such price movement, then we might also see additional signs from other markets that are necessary to strengthen or invalidate the bearish outlook.
Yesterday’s decline was much more volatile than the initial declines that followed the January 2018 and September 2017 tops, but this doesn’t change the possibility of seeing higher prices very temporarily before the slide continues. From September 14 to 15, gold rallied almost $20 before taking a plunge and from February 2 to 6, gold also rallied almost $20 before declining below $1,320. If we’re lucky, we could see the same kind of pattern shortly. At the moment of writing these words, the pre-market low is $1,325, so an analogous rally might take gold to about $1,345. This doesn’t make it a very likely upside target, but something that’s worth keeping in mind. If gold moves to this level, it will not be a bullish sign, but something in tune with the past – bearish – patterns.
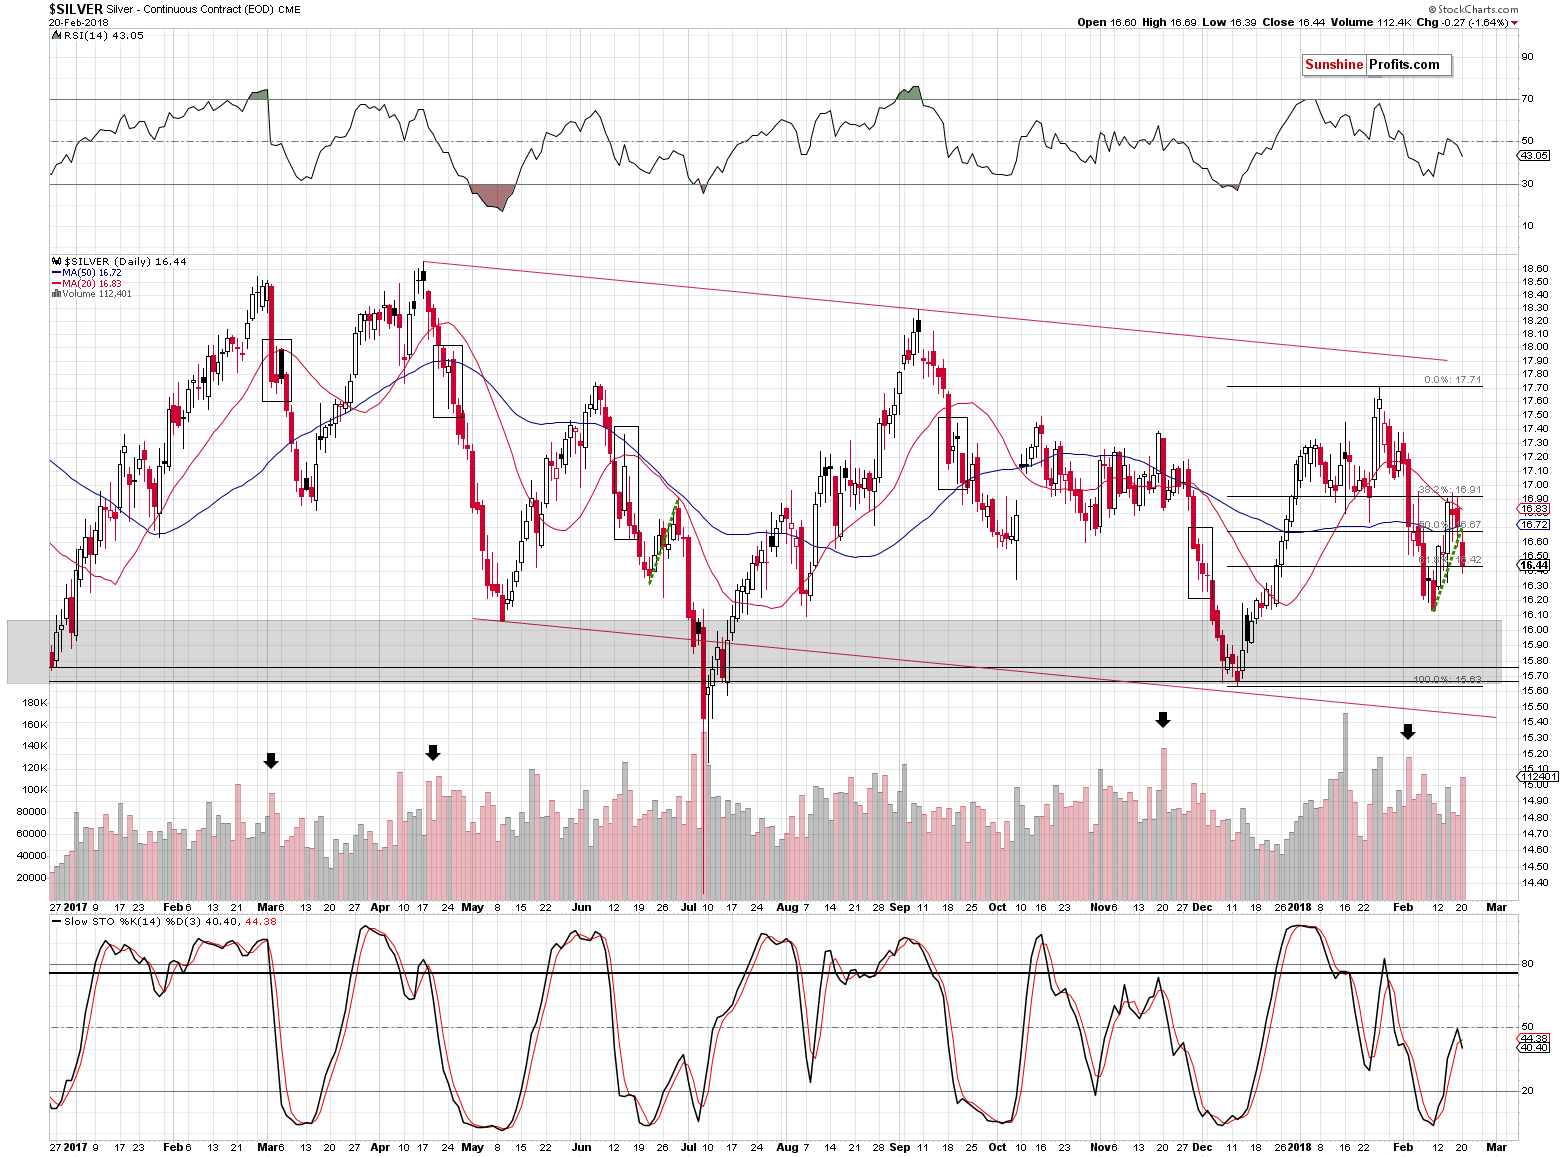
We hope for the above, because if the above takes place, we might see a very specific sign from the silver market and if we do, the probability for a decline in the entire precious metals sector will greatly increase.
We’ll leave details of the above-mentioned confirmation signal to our subscribers, but we can say that for now, we have a new sell signal from the Stochastic indicator, which already serves as a bearish sign. It’s not enough to change the outlook in a dramatic way, though.
Having said the above, let’s turn to mining stocks.
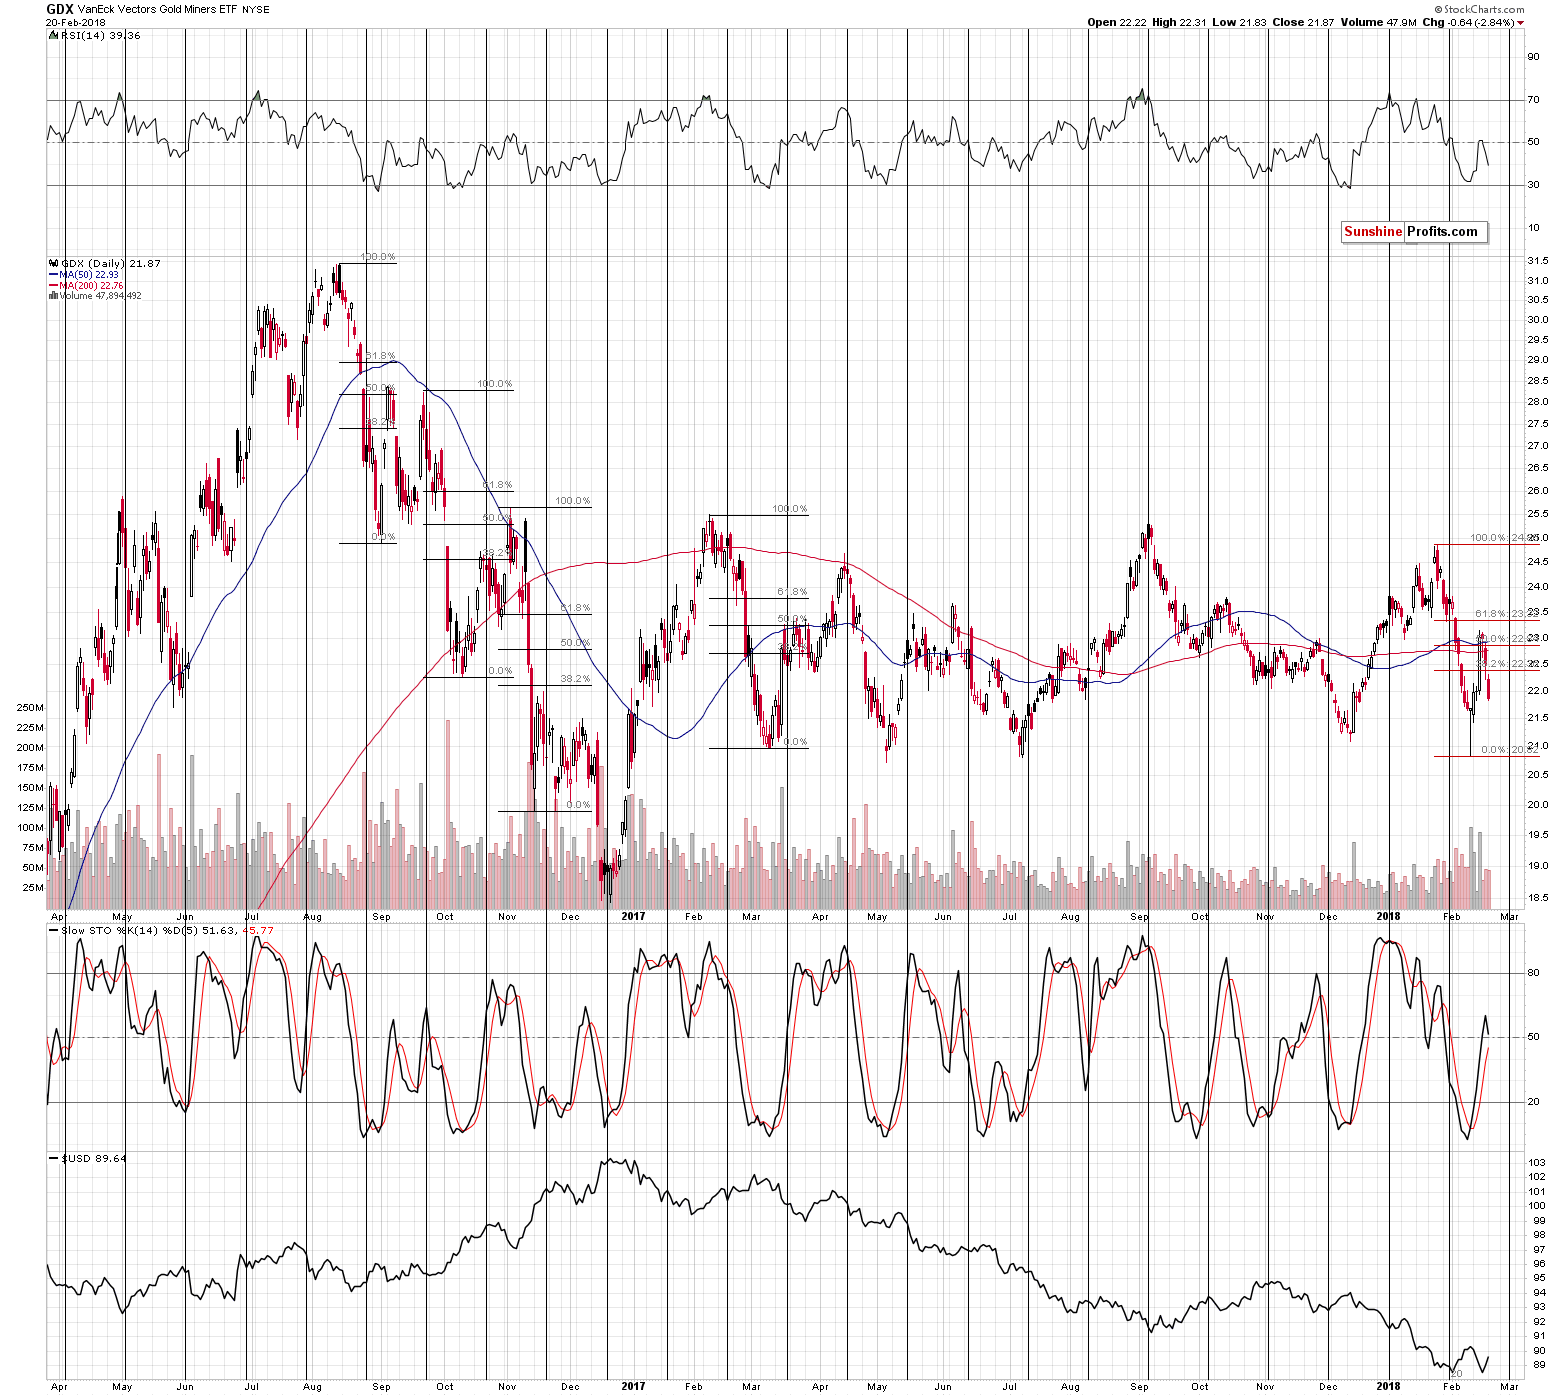
The Valentine’s Day rally is officially erased. And more. Not only did mining stocks erase the entire daily upswing that got everyone and their brother excited, but they also declined below the previous two trading days’ closing prices. In fact, yesterday’s closing price is the 4th lowest close of the year.
The above is a sign of underperformance of mining stocks relatively to gold, which is a bearish factor.
The 50% retracement along with the 50- and 200-day moving averages seem to have stopped the rally. During the day of the rally we informed our subscribers that the miners are not likely to move much above the above-mentioned retracement as that’s what happened during previous major declines.
The last big and volatile downswing that was followed by a sharp upswing in GDX was seen in February and March 2017. The upswing took miners to about 50% Fibonacci retracement, before stopping. The preceding similar situations took place in the second half of 2016. When GDX declined sharply in August, it rallied back up just a little above the 50% Fibonacci retracement. The decline that started in September corrected initially to the 38.2% retracement, but ended only after miners moved a bit above the 50% retracement. The November decline was corrected to the 38.2% retracement.
We just saw something very similar to the above cases. Consequently, the recent rally was not a game-changer - it was a quite normal part of a decline.
Based on the above and on the signs from USD and gold, we have most likely indeed seen a topping pattern.
But why did the mining stocks decline so far and then rallied back up in the first place?
That’s most likely the impact of the price action in the main stock indices. Stocks’ decline was very volatile, and it sank miners as well. The subsequent rebound contributed to miners’ revival. Then, once the volatility decreased, the impact that the general stock market had on the miners decreased substantially as well. In other words, things are now back to normal.
What is normal for mining stocks at this time? Most signs point to decline’s continuation, but we should also take into account the possibility that the decline could continue according to the pattern that is already in place. If you examine the Fibonacci retracements that we marked on the above chart, you’ll see that it was usually the case (September 2016, November 2016, December 2016) that the initial rally in the miners was not the final one before the big slide. Consequently, if we see another short-term upswing here, it will not necessarily be a bullish factor. In fact, it may – depending on the way it takes place and the action in silver – even serve as a bearish sign.
Measuring Miners’ Relative Performance
Before summarizing, we will feature our reply to a question that we received about out- and underperformance of mining stocks. The question was how to check it, since mining stocks generally multiple daily swings in gold in both directions.
There are couple of ways, in which one can compare the performance of mining stocks to the performance of gold.
Firstly, you can look at the percentage change on each day. This will not detect any subtle out- and underperformance cases, but it's enough for the big ones. For instance, if gold is up by $4 or so and gold stocks are down 1% - it's clear that the mining stocks are underperforming on that day. If the case is not that obvious, we look at what was the usual way in which miners recently performed relative to gold. Did it change and how significantly? If gold's rallies used to be magnified 2x during a certain rally, but now it quickly declined to 1.5x, the 1x, then 0.5x and then to just 0.1x - it's a clear case of underperformance and a bearish signal.
Secondly, you can look at the daily price moves as compared to most recent price swings. For instance, gold erases last month's decline, but miners erase only half of last month's decline - that's a bearish sign.
Thirdly, you can look at the GDX to GLD or HUI to gold ratios. If the ratio breaks below a certain level or is in a clear short-term downtrend despite a move higher in gold, then it suggests that something is wrong with the rally and that it's about to end.
Want free follow-ups to the above article and details not available to 99%+ investors? Sign up to our free newsletter today!
Author

Przemyslaw Radomski, CFA
Sunshine Profits
Przemyslaw Radomski, CFA (PR) is a precious metals investor and analyst who takes advantage of the emotionality on the markets, and invites you to do the same. His company, Sunshine Profits, publishes analytical software that any


