Merry Christmas [Video]
![Merry Christmas [Video]](https://editorial.fxstreet.com/images/Markets/Currencies/Majors/DollarIndex/financial-planning-calculator-twenties-1784220_XtraLarge.jpg)
US Dollar: Mar '23 USD is Down at 103,955.
Energies: Feb '23 Crude is Up at 78.93.
Financials: The Mar '23 30 Year T-Bond is Down 22 ticks and trading at 127.24.
Indices: The Mar '23 S&P 500 emini ES contract is 27 ticks Higher and trading at 3956.00.
Gold: The Feb'23 Gold contract is trading Up at 1805.20. Gold is 99 ticks Higher than its close.
Initial conclusion
This is a nearly correlated market. The dollar is Down, and Crude is Up which is normal, and the 30 Year T-Bond is trading Lower. The Financials should always correlate with the US dollar such that if the dollar is lower, then the bonds should follow and vice-versa. The S&P is Higher, and Crude is trading Higher which is not correlated. Gold is trading Higher which is correlated with the US dollar trading Down. I tend to believe that Gold has an inverse relationship with the US Dollar as when the US Dollar is down, Gold tends to rise in value and vice-versa. Think of it as a seesaw, when one is up the other should be down. I point this out to you to make you aware that when we don't have a correlated market, it means something is wrong. As traders you need to be aware of this and proceed with your eyes wide open. Currently all of Asia is trading Lower. All of Europe is trading mainly Higher with the exception of the Paris and Milan exchanges which are Lower.
Possible challenges to traders today
-
Core PCE Price Index is out at 8:30 AM EST. This is Major.
-
Core Durable Goods Orders is out at 8:30 AM EST. Major.
-
Durable Goods Orders is out at 8:30 AM EST. This is Major.
-
Personal Income is out at 8:30 AM EST. This is Major.
-
Personal Spending is out at 8:30 AM EST.This is Major.
-
New Home Sales is out at 10 AM EST. This is Major.
-
Revised UoM Consumer Sentiment is out at 10 AM. Not Major
-
Revised UoM Inflation Expectations is out at 10 AM. Not Major.
Treasuries
Traders, please note that we've changed the Bond instrument from the 30 year (ZB) to the 10 year (ZN). They work exactly the same.
We've elected to switch gears a bit and show correlation between the 10-year bond (ZN) and the S&P futures contract. The S&P contract is the Standard and Poor's, and the purpose is to show reverse correlation between the two instruments. Remember it's likened to a seesaw, when up goes up the other should go down and vice versa.
Yesterday the ZN hit a Low at around 9:35 AM EST. The S&P was in a Downswing at around the same time. If you look at the charts below ZN gave a signal at around 9:35 AM and the S&P gave a signal at around the same time. Look at the charts below and you'll see a pattern for both assets. ZN hit a Low at around 9:35 AM and migrated Higher. These charts represent the newest version of MultiCharts and I've changed the timeframe to a 15-minute chart to display better. This represented a Long opportunity on the 10-year note, as a trader you could have netted about 18 ticks per contract on this trade. Each tick is worth $15.625. Please note: the front month for the ZN is now Mar '23. The S&P contract is now Mar' 23 as well. I've changed the format to Renko Bars such that it may be more apparent and visible.
Charts courtesy of MultiCharts built on an AMP platform
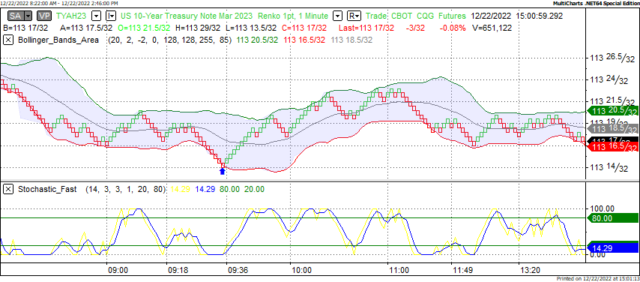
ZN - Mar 2023 - 12/22/22
-638073952876222496.png)
S&P - Dec 2022 - 12/22/22
Bias
Yesterday we gave the markets a Neutral bias as we saw no semblance of market correlation Thursday morning. The markets veered to the Downside as the Dow dropped 349 points and the other indices dropped as well. Today we are dealing with a nearly correlated market, and it's correlated to the Upside. Hence our bias is to the Upside.
Could this change? Of Course. Remember anything can happen in a volatile market.
Commentary
As the old saying goes "what goes Up must come Down" and yesterday was no exception. It doesn't appear as though we'll have a Santa Claus rally this year (unless it happens today). The markets took back some of the gains achieved on Wednesday and ironically we have more economic news today than yesterday. Will that serve as a hindrance? Only time will tell. On another note, Monday the markets will be closed for the Christmas Holiday, we will be back on Tuesday, the 27th. We wish you and yours a very happy and safe holiday.
Author

Nick Mastrandrea
Market Tea Leaves


