Mega Merger Moves Markets
Good Morning Traders,
As of this writing 4:45 AM EST, here’s what we see:
US Dollar: Jun. USD is Down at 97.245.
Energies: July Crude is Up at 44.52.
Financials: The Sept 30 year bond is Up 11 ticks and trading at 155.25.
Indices: The June S&P 500 emini ES contract is 4 ticks Higher and trading at 2448.50.
Gold: The Aug gold contract is trading Up at 1248.20. Gold is 15 ticks Higher than its close.
Initial Conclusion
This is not a correlated market. The dollar is Down- and crude is Up+ which is normal but the 30 year bond is trading Higher. The Financials should always correlate with the US dollar such that if the dollar is lower then bonds should follow and vice-versa. The indices are Up and Crude is trading Up+ which is not correlated. Gold is trading Up+ which is correlated with the US dollar trading Down-. I tend to believe that Gold has an inverse relationship with the US Dollar as when the US Dollar is down, Gold tends to rise in value and vice-versa. Think of it as a seesaw, when one is up the other should be down. I point this out to you to make you aware that when we don’t have a correlated market, it means something is wrong. As traders you need to be aware of this and proceed with your eyes wide open.
At this hour Asia is trading mixed with half the exchanges trading Higher and the other half Lower. All of Europe is trading Higher at this hour.
Possible Challenges To Traders Today
– FOMC Member Fischer Speaks at 8 AM EST. This is major.
– Current Account is out at 8:30 AM EST. This is major.
– FOMC Member Kaplan Speaks at 3 PM EST. This is major.
Treasuries
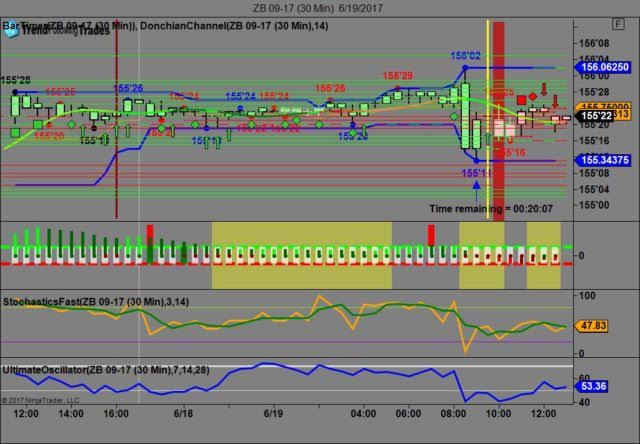
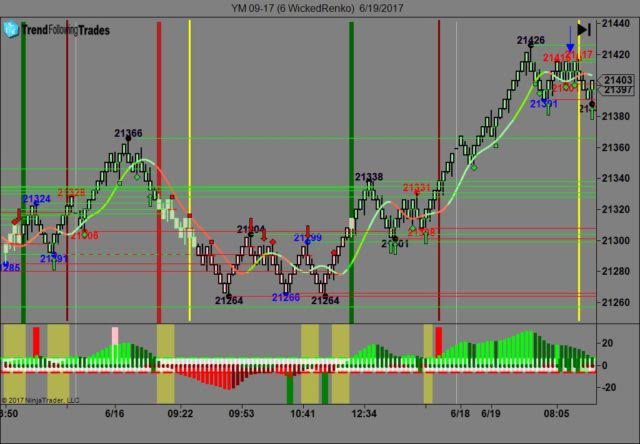
We’ve elected to switch gears a bit and show correlation between the 30 year bond (ZB) and The YM futures contract. The YM contract is the DJIA and the purpose is to show reverse correlation between the two instruments. Remember it’s liken to a seesaw, when up goes up the other should go down and vice versa.
Yesterday the ZB made it’s move at around 9 AM EST with no economic news in sight. The ZB hit a low at around that time and the YM hit a high. If you look at the charts below ZB gave a signal at around 9 AM and the YM was moving lower at the same time. Look at the charts below and you’ll see a pattern for both assets. ZB hit a low at around 9 AM and the YM hit a high. These charts represent the newest version of Trend Following Trades and I’ve changed the timeframe to a 30 minute chart to display better. This represented a long opportunity on the 30 year bond, as a trader you could have netted about 15 ticks per contract on this trade. Each tick is worth $31.25. We added a Donchian Channel to the charts to show the signals more clearly. Please note that the front month for the ZB contract is now September, 2017.
Charts Courtesy of Trend Following Trades built on a NinjaTrader platform.
Bias
Yesterday we gave the markets a neutral bias as the indices didn’t have a firm sense of direction Monday morning. The Dow rose 145 points and the other indices rose as well. Today we aren’t dealing with a correlated market and our bias is neutral.
Could this change? Of Course. Remember anything can happen in a volatile market.
Commentary
Yesterday we gave the markets a neutral bias as the USD and Bonds were trading higher yesterday morning and this is usually indicative of a downside move except the indices were all moving higher yesterday morning which indicates confusion hence the neutral bias. Given that this is Amazon’s first foray into retail grocery Whole Foods stock price was inflated by about 4-5% yesterday. Could a bidding war be underway? Only time will tell…
Author

Nick Mastrandrea
Market Tea Leaves


