Markets veer to the downside [Video]
![Markets veer to the downside [Video]](https://editorial.fxstreet.com/images/Markets/Currencies/Majors/DollarIndex/dollars-roll-gm178824866-25196405_XtraLarge.jpg)
US Dollar: Dec '22 USD is Up at 111.800.
Energies: Nov '22 Crude is Down at 81.75.
Financials: The Dec '22 30 Year bond is Down 14 ticks and trading at 127.26.
Indices: The Dec '22 S&P 500 emini ES contract is 126 ticks Lower and trading at 3750.50.
Gold: The Dec'22 Gold contract is trading Down at 1664.00. Gold is 171 ticks Lower than its close.
Initial conclusion
This is not a correlated market. The dollar is Up, and Crude is Down which is normal, and the 30-year Bond is trading Lower. The Financials should always correlate with the US dollar such that if the dollar is lower, then the bonds should follow and vice-versa. The S&P is Lower, and Crude is trading Lower which is not correlated. Gold is trading Lower which is correlated with the US dollar trading Up. I tend to believe that Gold has an inverse relationship with the US Dollar as when the US Dollar is down, Gold tends to rise in value and vice-versa. Think of it as a seesaw, when one is up the other should be down. I point this out to you to make you aware that when we don't have a correlated market, it means something is wrong. As traders you need to be aware of this and proceed with your eyes wide open. Currently all of Asia is trading Lower. All of Europe is trading Lower as well.
Possible challenges to traders today
-
Flash Services PMI is out at 9:45 AM EST. This is Major.
-
Flash Manufacturing PMI is out at 9:45 AM EST. Major.
-
Fed Chair Powell Speaks at 2 PM EST. This is Major.
Treasuries
Traders, please note that we've changed the Bond instrument from the 30 year (ZB) to the 10 year (ZN). They work exactly the same.
We've elected to switch gears a bit and show correlation between the 10-year bond (ZN) and the S&P futures contract. The S&P contract is the Standard and Poor's, and the purpose is to show reverse correlation between the two instruments. Remember it's likened to a seesaw, when up goes up the other should go down and vice versa.
Yesterday the ZN made its move at around 7:30 AM EST. The ZN hit a Low at around that time and the S&P moved Lower at around the same time. If you look at the charts below ZN gave a signal at around 7:30 AM and the S&P moved Lower at around the same time. Look at the charts below and you'll see a pattern for both assets. ZN hit a Low at around 7:30 AM and the S&P was moving Lower shortly thereafter. These charts represent the newest version of MultiCharts and I've changed the timeframe to a 15-minute chart to display better. This represented a Long opportunity on the 10-year note, as a trader you could have netted about 20 ticks per contract on this trade. Each tick is worth $15.625. Please note: the front month for the ZN is now Dec '22. The S&P contract is also Dec' 22. I've changed the format to Renko Bars such that it may be more apparent and visible.
Charts courtesy of MultiCharts built on an AMP platform
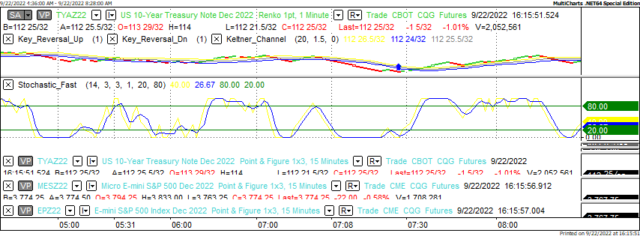
ZN - Dec 2022 - 09/22/22
-637995280713325379.png)
S&P - Dec 2022 - 9/22/22
Bias
Yesterday we gave the indices a Neutral bias as we saw no real evidence of Market Correlation, hence the Neutral or Mixed Bias. The markets veered to the Downside as the Dow closed 107 points Lower and the other indices traded Lower as well. Today we aren't dealing with a correlated and our bias is Neutral.
Could this change? Of Course. Remember anything can happen in a volatile market.
Commentary
Well, yesterday was the day after the FOMC meeting and you might think that the markets would show a bit more normalcy. No so, not the case. Yesterday morning was very confusing as it appeared as though might have gone Higher but drifted back into negative territory and remained there till the session closed. Today we have Flash Services PMI and Fed Chair Powell will be speaking this afternoon at 2 PM EST. Perhaps what he says may turn the markets around but as in all things, only time will tell.
Author

Nick Mastrandrea
Market Tea Leaves


