Markets Up Despite Empire State [Video]
![Markets Up Despite Empire State [Video]](https://editorial.fxstreet.com/images/Markets/Currencies/all-kinds-of-money-11794393_XtraLarge.jpg)
US Dollar: Sept USD is Up at 97.240.
Energies: July '19 Crude is Down at 51.56.
Financials: The Sept 30 year bond is Up 23 ticks and trading at 155.11.
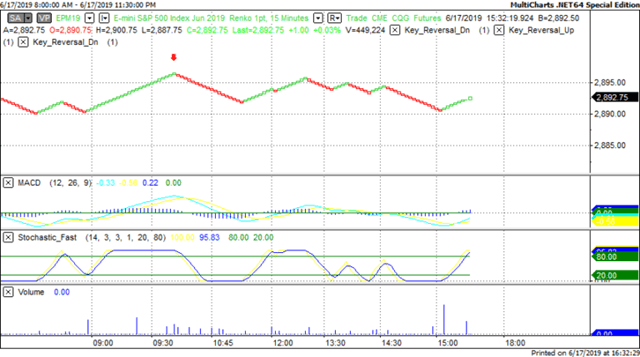
Indices: The June S&P 500 emini ES contract is 32 ticks Higher and trading at 2900.00.
Gold: The June Gold contract is trading Up at 1349.90. Gold is 70 ticks Higher than its close.
Initial Conclusion
This is not a correlated market. The dollar is Down- and Crude is Up+ which is normal but the 30 year Bond is trading Higher. The Financials should always correlate with the US dollar such that if the dollar is lower then bonds should follow and vice-versa. The S&P is Higher and Crude is trading Higher which is not correlated. Gold is trading Higher which is correlated with the US dollar trading Down. I tend to believe that Gold has an inverse relationship with the US Dollar as when the US Dollar is down, Gold tends to rise in value and vice-versa. Think of it as a seesaw, when one is up the other should be down. I point this out to you to make you aware that when we don't have a correlated market, it means something is wrong. As traders you need to be aware of this and proceed with your eyes wide open.
All of Asia traded Higher with the exception of the Japanese Nikkei which traded Lower. As of this writing all of Europe is trading Higher.
Possible Challenges To Traders Today
-
Building Permits are out at 8:30 AM EST. This is major.
-
Housing Starts are out at 8:30 AM EST. This is major.
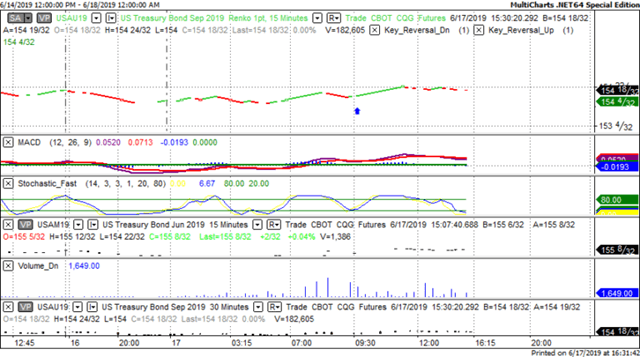
Treasuries
We've elected to switch gears a bit and show correlation between the 30 year bond (ZB) and The YM futures contract. The YM contract is the DJIA and the purpose is to show reverse correlation between the two instruments. Remember it's liken to a seesaw, when up goes up the other should go down and vice versa.
Yesterday the ZB made a major move at around 9:45 AM EST. The ZB hit a Low at around that time and the YM hit a High. If you look at the charts below ZB gave a signal at around 9:45 AM EST and the YM was moving Lower at the same time. Look at the charts below and you'll see a pattern for both assets. ZB hit a Low at around 9:45 AM and the YM was moving Lower at the same time. These charts represent the newest version of MultiCharts and I've changed the timeframe to a 15 minute chart to display better. This represented a Long opportunity on the 30 year bond, as a trader you could have netted about a dozen ticks per contract on this trade. Each tick is worth $31.25. Please note: the front month for the ZB contract is now September, 2019 and I've changed the format to Renko bars such that it may be more apparent and visible.
Charts Courtesy of MultiCharts built on an AMP platform.
Bias
Yesterday we gave the markets an Upside bias as the USD, Bonds and Gold were all pointing Lower yesterday morning and that does bode well for an Upside day, hence the Upside bias. The markets didn't disappoint as the Dow gained 23 points and the other indices gained ground as well. Today we aren't dealing with a correlated market and our bias is Neutral.
Could this change? Of Course. Remember anything can happen in a volatile market.
Commentary
It appears as though no one really pays attention to the economic news reported these days. Yesterday the Empire State Manufacturing Index dropped to a minus 8.6% and I don't ever recall it dropping that low even during the Great Recession. Yet by some miracle the markets gained ground and chose to ignore this vital data. Now we have the President threatening a recession if he's not re-elected. Gee what will happen in 2024 when he can't run again? It would seem to me that the whole market (institutionals, the Smart Money, Traders, etc.) are all clamoring to see if the Federal Reserve will issue a rate cut. Obviously this will bolster the markets but no one really know what the Fed will do or not; we'll all find out come Wednesday afternoon.
Author

Nick Mastrandrea
Market Tea Leaves


