Firing Powell? Trump, the Fed, and a brewing storm before the bell

USD: Sept '25 is Up at 98.450.
Energies: Aug '25 Crude is Up at 65.44.
Financials: The Sep '25 30 Year T-Bond is Lower by 5 ticks and trading at 112.00.
Indices: The Sep '25 S&P 500 emini ES contract is 5 ticks Lower and trading at 6302.00.
Gold: The Aug'25 Gold contract is trading Down at 3330.70.
Initial conclusion
This is not a correlated market. The USD is Up and Crude is Up which is not normal, and the 30 Year T-Bond is trading Lower. The Financials should always correlate with the US dollar such that if the dollar is Higher, then the bonds should follow and vice-versa. The S&P is Lower and Crude is trading Higher which is correlated. Gold is trading Lower which is correlated with the US dollar trading Up. I tend to believe that Gold has an inverse relationship with the US Dollar as when the US Dollar is down, Gold tends to rise in value and vice-versa. Think of it as a seesaw, when one is up the other should be down. I point this out to you to make you aware that when we don't have a correlated market, it means something is wrong. As traders you need to be aware of this and proceed with your eyes wide open. Asia traded mainly Lower with the exception of the Sensex and Singapore exchanges. All of Europe is trading Higher.
Possible challenges to traders
-
Retail Sales is out at 8:30 AM EST. This is Major.
-
Core Related Retail Sales m/m is out at 8:30 AM EST. This is Major.
-
Unemployment Claims is out at 8:30 AM EST. This is Major.
-
Philly Fed Mfg. Index is out at 8:30 AM EST. This is Major.
-
Import Prices m/m is out at 8:30 AM EST. This is Major.
-
Business Inventories is out at 10 AM EST. This is Major.
-
FOMC Member Kugler Speaks at 10 AM EST. This is Major.
-
NAHB Housing Market Index is out at 10 AM EST. This is Major.
-
Natural Gas Storage is out at 10:30 AM EST. This is Major.
-
FOMC Member Daly Speaks at 12:45 PM EST. This is Major.
-
FOMC Member Cook Speaks at 1:30 PM EST. This is Major.
Traders, please note that we've changed the Bond instrument from the 10 Year (ZN) to the 2 Year (ZT). They work exactly the same.
We've elected to switch gears a bit and show correlation between the 2-year Treasury notes (ZT) and the S&P futures contract. The YM contract is the Dow Jones Industrial Average, and the purpose is to show reverse correlation between the two instruments. Remember it's likened to a seesaw, when up goes up the other should go down and vice versa.
Yesterday the ZT climbed Higher at around 8:30 AM EST with no eco news pending. The Dow dived Lower at the same time. Look at the charts below and you'll see a pattern for both assets. The Dow dived Lower at 8:30 AM EST and the ZT climbed Higher at around the same time. These charts represent the newest version of Bar Charts, and I've changed the timeframe to a 15-minute chart to display better. This represented a Long opportunity on the 2-year note, as a trader you could have netted about 30 plus ticks per contract on this trade. Each tick is worth $6.25. Please note: the front month for ZT is now Sep '25 and the Dow is now Sep '25. I've changed the format to filled Candlesticks (not hollow) such that it may be more apparent and visible.
Charts courtesy of BarCharts
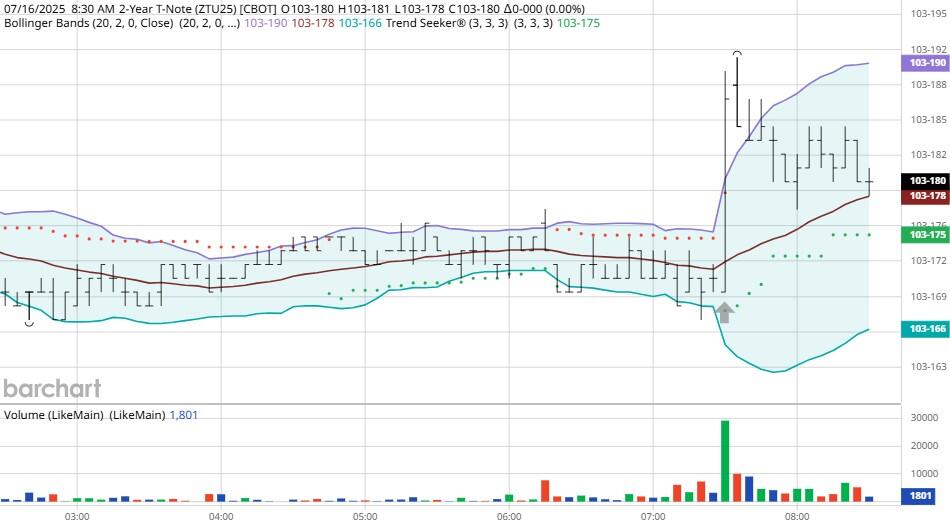
ZT -Sep 25 - 7/16/25
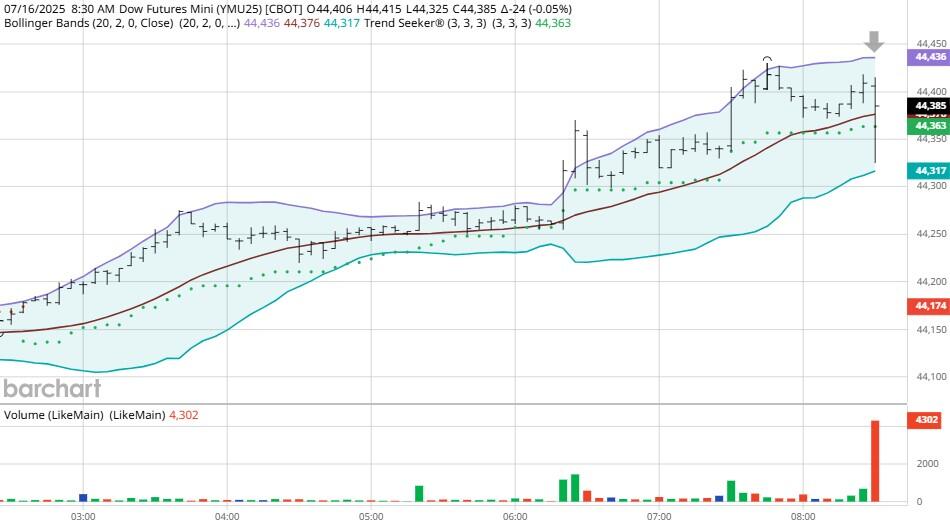
Dow - Sep 2025- 7/16/25
Bias
Yesterday we gave the markets a Neutral or Mixed bias, but the markets had other ideas and climbed Higher. The Dow gained 231 points, and the other indices climbed Higher as well. Today we aren't dealing with a correlated market, and our bias will remain Neutral or Mixed.
Could this change? Of Course. Remember anything can happen in a volatile market.
Commentary
There are some rumors basically stating that Trump is threating to fire Fed Chair Powell. First it is illegal for any president to do so but I guess that never stopped Trump in the past. Second, last week there was a news item about Powell going over budget on the new FOMC headquarters. I find it interesting that someone wants to fire Powell for supposed malfeasance. Want to learn Market Correlation and determine market direction hours before the Opening Bell?
Author

Nick Mastrandrea
Market Tea Leaves


