Markets Take a U Turn

Good Morning Traders,
As of this writing 4 AM EST, here’s what we see:
US Dollar: Jun. USD is Up at 89.870.
Energies: May '18 Crude is Up at 62.15.
Financials: The June 30 year bond is Down 10 ticks and trading at 144.04.
Indices: The June S&P 500 emini ES contract is 32 ticks Lower and trading at 2748.00.
Gold: The April gold contract is trading Down at 1308.70. Gold is 38 ticks Lower than its close.
Initial Conclusion
This is not a correlated market. The dollar is Up+ and Crude is Down- which is normal but the 30 year Bond is trading Lower. The Financials should always correlate with the US dollar such that if the dollar is lower then bonds should follow and vice-versa. The S&P is Lower and Crude is trading Down- which is not correlated. Gold is trading Down- which is correlated with the US dollar trading Up+. I tend to believe that Gold has an inverse relationship with the US Dollar as when the US Dollar is down, Gold tends to rise in value and vice-versa. Think of it as a seesaw, when one is up the other should be down. I point this out to you to make you aware that when we don't have a correlated market, it means something is wrong. As traders you need to be aware of this and proceed with your eyes wide open.
At this hour Asia is trading mainly Lower with the exception of the Hang Seng and Shanghai exchanges which are higher at this time. Currently all of Europe is trading Higher.
Possible Challenges To Traders Today
-
FOMC Member Bostic Speaks at 9:40 AM EST. This is major.
-
Lack of major economic news.
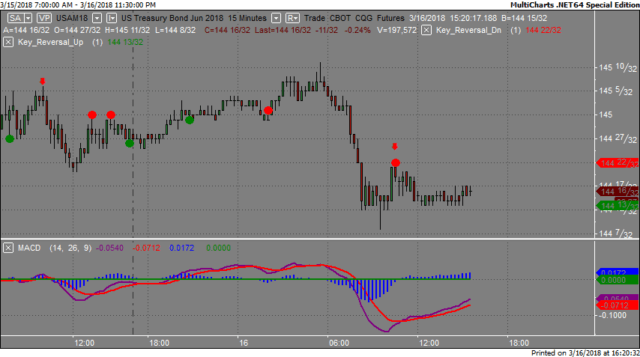
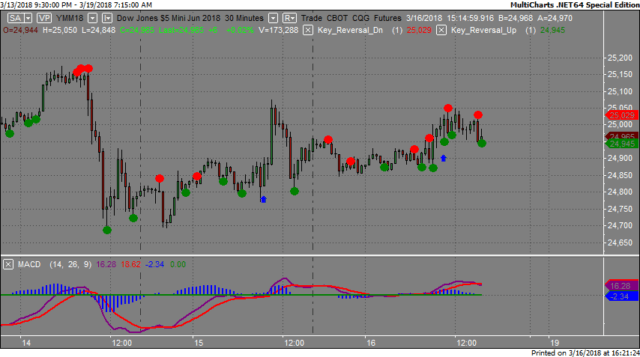
Treasuries
We've elected to switch gears a bit and show correlation between the 30 year bond (ZB) and The YM futures contract. The YM contract is the DJIA and the purpose is to show reverse correlation between the two instruments. Remember it's liken to a seesaw, when up goes up the other should go down and vice versa.
On Friday the ZB made it's move at around 10:30 AM. The ZB hit a High at around that time and the YM hit a Low. If you look at the charts below ZB gave a signal at around 10:30 AM EST and the YM was moving Higher at the same time. Look at the charts below and you'll see a pattern for both assets. ZB hit a High at around 10:30 AM and the YM hit a Low. These charts represent the newest version of MultiCharts and I've changed the timeframe to a 30 minute chart to display better. This represented a Shorting opportunity on the 30 year bond, as a trader you could have netted about a dozen ticks per contract on this trade. Each tick is worth $31.25.
Charts Courtesy of MultiCharts built on an AMP platform
Bias
On Friday we gave the markets a Downside bias as all the instruments we track were all pointed Higher Friday morning. This usually reflects a Downside day hence the Downside bias. The markets however had other ideas as the Dow closed 73 points higher and the other indices traded higher as well. Today we aren't dealing with a correlated market and our bias is Neutral
Could this change? Of Course. Remember anything can happen in a volatile market.
Commentary
On Friday we gave the markets a Downside bias as all the instruments we track were pointed higher Friday morning. However we did have pretty good economic news Friday morning which in turn propelled the markets forward. Consumer Sentiment, Jolts Job Openings and Inflation Expectations served to move the markets forward. Inflation Expectations are particularly important as the FOMC Meeting will be held this Wednesday, March 21st and a key component to that is inflation and job growth.
Author

Nick Mastrandrea
Market Tea Leaves


