Markets take a dive [Video]
![Markets take a dive [Video]](https://editorial.fxstreet.com/images/TechnicalAnalysis/Intermarket/Correlation/it-must-work-gm537868515-58464346_XtraLarge.jpg)
US Dollar: Dec '22 USD is Down at 106.195.
Energies: Jan '23 Crude is Up at 79.14.
Financials: The Mar '23 30 Year T-Bond is Up 23 ticks and trading at 128.03.
Indices: The Dec '22 S&P 500 emini ES contract is 29 ticks Higher and trading at 3977.25.
Gold: The Feb'23 Gold contract is trading Up at 1769.90. Gold is 146 ticks Higher than its close.
Initial conclusion
This is not a correlated market. The dollar is Down, and Crude is Up which is normal, but the 30 Year T-Bond is trading Higher. The Financials should always correlate with the US dollar such that if the dollar is lower, then the bonds should follow and vice-versa. The S&P is Higher, and Crude is trading Higher which is not correlated. Gold is trading Higher which is correlated with the US dollar trading Down. I tend to believe that Gold has an inverse relationship with the US Dollar as when the US Dollar is down, Gold tends to rise in value and vice-versa. Think of it as a seesaw, when one is up the other should be down. I point this out to you to make you aware that when we don't have a correlated market, it means something is wrong. As traders you need to be aware of this and proceed with your eyes wide open. Currently all of Asia is trading Higher with the exception of the Nikkei exchange which is Lower. Currently Europe is trading Higher with the exception of the Milan and Spanish Ibex exchanges which are Lower.
Possible challenges to traders today
-
HPI m/m is out at 9 AM EST. This is Major.
-
S&P/CS Composite-20 HPI is out at 9 AM EST. This is Major.
-
CB Consumer Confidence is out at 10 AM EST. This is Major.
Treasuries
Traders, please note that we've changed the Bond instrument from the 30 year (ZB) to the 10 year (ZN). They work exactly the same.
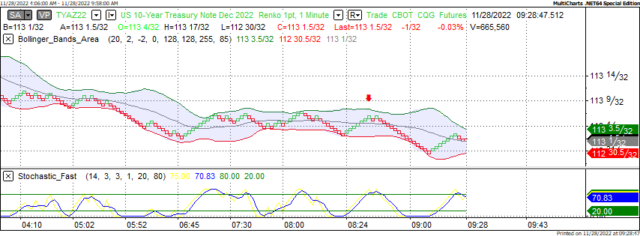
We've elected to switch gears a bit and show correlation between the 10-year bond (ZN) and the S&P futures contract. The S&P contract is the Standard and Poor's, and the purpose is to show reverse correlation between the two instruments. Remember it's likened to a seesaw, when up goes up the other should go down and vice versa.
Yesterday the Bonds hit a High at around 8:30 AM EST. The S&P hit a Low at around that time and the Bonds moved Lower shortly thereafter. If you look at the charts below ZN gave a signal at around 8:30 AM and the S&P gave a signal at around the same time. Look at the charts below and you'll see a pattern for both assets. ZN hit a High at around 8:30 AM and the S&P moved Higher shortly thereafter. These charts represent the newest version of MultiCharts and I've changed the timeframe to a 15-minute chart to display better. This represented a Short opportunity on the 10-year note, as a trader you could have netted about a dozen ticks per contract on this trade. Each tick is worth $15.625. Please note: the front month for the ZN is now Dec '22. The S&P contract is also Dec' 22. I've changed the format to Renko Bars such that it may be more apparent and visible.
Charts courtesy of MultiCharts built on an AMP platform
ZN - Dec 2022 - 11/28/22
-638053206525086519.png)
S&P - Dec 2022 - 11/28/22
Bias
Yesterday we gave the markets a Downside bias as both the Bonds and Gold were trading Higher Monday morning. This usually reflects a Downside Day, and the markets didn't disappoint. The Dow dropped 498 points and the other indices lost ground as well. Today we aren't dealing with a correlated market and our bias is Neutral.
Could this change? Of Course. Remember anything can happen in a volatile market.
Commentary
Yesterday was the first trading day back after a major holiday in the United States. I say the first day back because we don't count abbreviated sessions as this past Friday was. Usually after a major holiday with little or trading volume beforehand, we typically see either massive gains or massive losses. Unfortunately, yesterday represented losses as the Dow dropped nearly 500 points. In terms of economic news for today we have Home Price Index numbers as well as Consumer Confidence. Both of which are major and proven market movers. Will this turn the markets around? Only time will tell.
Author

Nick Mastrandrea
Market Tea Leaves


