Markets Take a Dip [Video]
![Markets Take a Dip [Video]](https://editorial.fxstreet.com/images/Markets/Equities/display-stock-market-charts-23026797_XtraLarge.jpg)
US Dollar: Dec USD is Down at 98.125.
Energies: Nov '19 Crude is Down at 53.28.
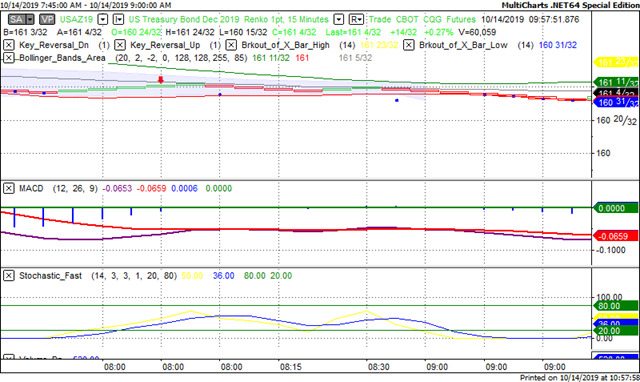
Financials: The Dec 30 year bond is Up 14 ticks and trading at 161.18.
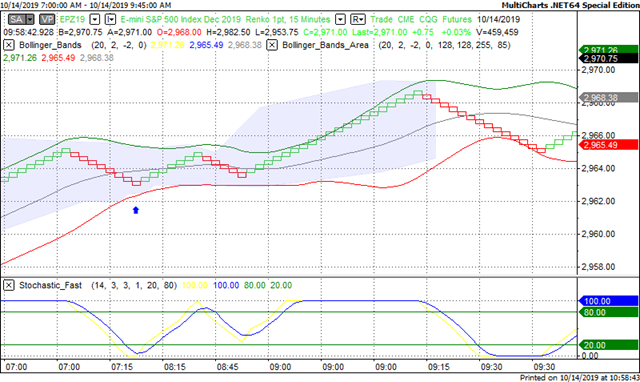
Indices: The Dec S&P 500 emini ES contract is 44 ticks Higher and trading at 2976.50.
Gold: The Dec Gold contract is trading Up at 1498.80. Gold is 12 ticks Higher than its close.
Initial Conclusion
This is not a correlated market. The dollar is Down- and Crude is Down- which is not normal but the 30 year Bond is trading Higher. The Financials should always correlate with the US dollar such that if the dollar is lower then bonds should follow and vice-versa. The S&P is Higher and Crude is trading Lower which is correlated. Gold is trading Higher which is correlated with the US dollar trading Down. I tend to believe that Gold has an inverse relationship with the US Dollar as when the US Dollar is down, Gold tends to rise in value and vice-versa. Think of it as a seesaw, when one is up the other should be down. I point this out to you to make you aware that when we don't have a correlated market, it means something is wrong. As traders you need to be aware of this and proceed with your eyes wide open.
At this time all of Asia is trading Mixed with half the exchanges Higher and the other half Lower. Currently all of Europe is trading Higher with the exception of the London exchange which is fractionally Lower at this time.
Possible Challenges To Traders Today
- Empire State Manufacturing Index is out at 8:30 AM EST. This is major.
- FOMC Member George Speaks at 12:45 PM. This is major.
- Federal Budget Balance is out at 2 PM EST. This is major.
- FOMC Member Bullard Speaks at 3:25 PM EST. This is major.
Treasuries
We've elected to switch gears a bit and show correlation between the 30 year bond (ZB) and The S&P futures contract. The S&P contract is the Standard and Poor's and the purpose is to show reverse correlation between the two instruments. Remember it's liken to a seesaw, when up goes up the other should go down and vice versa.
Yesterday the ZB made a major move at around 8 AM EST. The ZB hit a High at around that time and the S&P hit a Low. If you look at the charts below ZB gave a signal at around 8 AM EST and the S&P was moving Higher at the same time. Look at the charts below and you'll see a pattern for both assets. ZB hit a High at around 8 AM and the S&P was moving Higher at the same time. These charts represent the newest version of MultiCharts and I've changed the timeframe to a 15 minute chart to display better. This represented a Shorting opportunity on the 30 year bond, as a trader you could have netted about a dozen ticks per contract on this trade. Each tick is worth $31.25. Please note: the front month for the ZB is now December. The S&P contract is now at December as well and I've changed the format to Renko bars such that it may be more apparent and visible.
Charts Courtesy of MultiCharts built on an AMP platform
Bias
Yesterday we gave the markets a Downside bias as both the USD and the Bonds were trading Higher yesterday morning and this is generally indicative of a Downside Day. The markets didn't disappoint as the Dow dropped 29 points and the other indices lost ground as well. Today we aren't dealing with a correlated market and our bias is to the Upside.
Could this change? Of Course. Remember anything can happen in a volatile market.
Commentary
So another Columbus Day has come and gone and the markets didn't have any real economic news to drive it one way or the other. So what we do? We just simply followed our rules on Market Correlation which told that today would in all probability be a Downside day and guess what? It was a downside day. Today we have a bit more in terms of economic news and they are major. We have Empire State Manufacturing Index and two FOMC members speaking and that is always major. Of course we have the impeachment news to keep us on our toes. One thing is for certain, it isn't a boring market....
Author

Nick Mastrandrea
Market Tea Leaves


