Markets Swoop for New Years
US Dollar: Mar. USD is Down at 91.655.
Energies: Feb ’18 Crude is Up at 60.54.
Financials: The Mar 30 year bond is Down 18 ticks and trading at 152.14.
Indices: The Mar S&P 500 emini ES contract is 8 ticks Higher and trading at 2678.00.
Gold: The Feb gold contract is trading Up at 1311.80. Gold is 25 ticks Higher than its close.
Initial Conclusion
This is not a correlated market. The dollar is Down- and Crude is Up+ which is normal and the 30 year Bond is trading Lower. The Financials should always correlate with the US dollar such that if the dollar is lower then bonds should follow and vice-versa. The S&P is Higher and Crude is trading Up+ which is not correlated. Gold is trading Up+ which is correlated with the US dollar trading Down-. I tend to believe that Gold has an inverse relationship with the US Dollar as when the US Dollar is down, Gold tends to rise in value and vice-versa. Think of it as a seesaw, when one is up the other should be down. I point this out to you to make you aware that when we don’t have a correlated market, it means something is wrong. As traders you need to be aware of this and proceed with your eyes wide open.
At this hour Asia is trading mainly Higher with the exception of the Nikkei and Sensex exchanges which are Lower. As of this writing Europe is trading mainly Lower with the exception of the Spanish Ibex exchange which is Higher at this hour.
Possible Challenges To Traders Today
-
No major economic news.
-
Lack of major economic news.
Treasuries
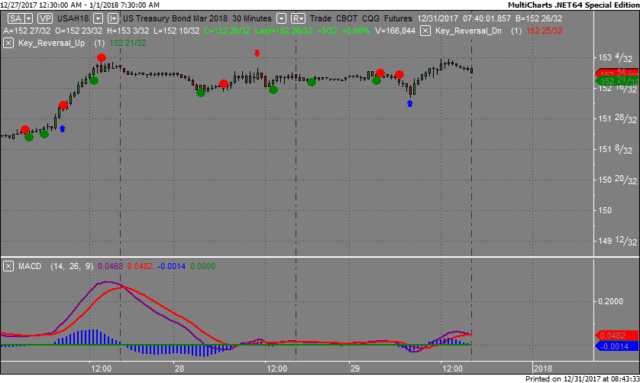
We’ve elected to switch gears a bit and show correlation between the 30 year bond (ZB) and The YM futures contract. The YM contract is the DJIA and the purpose is to show reverse correlation between the two instruments. Remember it’s liken to a seesaw, when up goes up the other should go down and vice versa.
Last Friday the ZB made it’s move at around 8 AM EST. The ZB hit a Low at around that time and the YM hit a High. If you look at the charts below ZB gave a signal at around 8 AM EST and the YM was moving Lower at the same time. Look at the charts below and you’ll see a pattern for both assets. ZB hit a Low at around 8 AM and the YM hit a High. These charts represent the newest version of Trend Following Trades and I’ve changed the timeframe to a 30 minute chart to display better. This represented a long opportunity on the 30 year bond, as a trader you could have netted about 15 plus ticks per contract on this trade. Each tick is worth $31.25. We added a Donchian Channel to the charts to show the signals more clearly.
Charts Courtesy of MultiCharts built on an AMP platform.

Bias
On Friday we gave the markets a Neutral bias as the markets didn’t seem to have any sense of direction last Friday morning. The Dow dropped 118 points and the other indices lost ground as well. Today we aren’t dealing with a correlated market however our bias is to the Upside.
Could this change? Of Course. Remember anything can happen in a volatile market.
Commentary
The day before the New Years weekend started one would think that the markets would want to roar into the New Years on a positive note. That didn’t occur last Friday as the markets drifted downward all day. It could very well be that the markets were exhausted and just needed to take a break. The same might be said of traders themselves as 2017 seemed to be a year on the endless rally. Besides Auto or Total Vehicle Sales out and the FOMC Meeting Minutes they two reports could in fact change market direction so it’s something to be mindful of if trading today.
Author

Nick Mastrandrea
Market Tea Leaves


