Markets Still Adamant
US Dollar: Mar. USD is Up at 101.565.
Energies: March Crude is Down at 54.31.
Financials: The Mar 30 year bond is Down 4 ticks and trading at 151.06.
Indices: The March S&P 500 emini ES contract is 5 ticks Higher and trading at 2361.25.
Gold: The April gold contract is trading Down at 1237.50. Gold is 14 ticks Lower than its close.
Initial Conclusion
This is a nearly correlated market. The dollar is Up+ and crude is Down- which is normal but the 30 year bond is trading Lower. The Financials should always correlate with the US dollar such that if the dollar is lower then bonds should follow and vice-versa. The indices are Up and Crude is trading Down which is correlated. Gold is trading Down which is correlated with the US dollar trading Up. I tend to believe that Gold has an inverse relationship with the US Dollar as when the US Dollar is down, Gold tends to rise in value and vice-versa. Think of it as a seesaw, when one is up the other should be down. I point this out to you to make you aware that when we don’t have a correlated market, it means something is wrong. As traders you need to be aware of this and proceed with your eyes wide open.
Asia traded higher with the exception of the Japanese Nikkei exchange which traded lower. As of this writing all of Europe is trading higher with the exception of the Milan exchange which is trading lower at this hour.
Possible Challenges To Traders Today
– Existing Home Sales is out at 10 AM EST. This is major.
– FOMC Member Powell Speaks at 1 PM EST. This is major.
– FOMC Meeting Minutes is out at 2 PM EST. This is major.
Treasuries
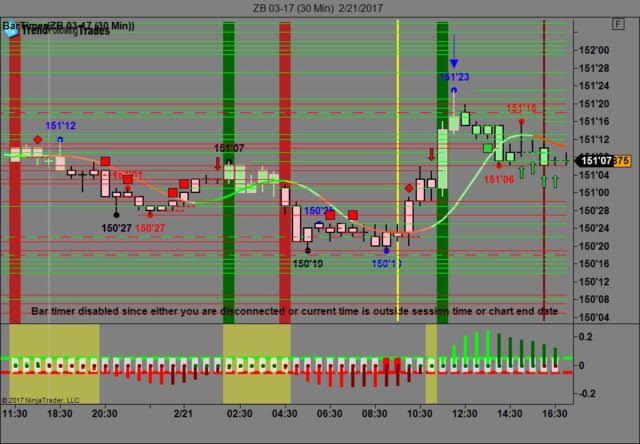
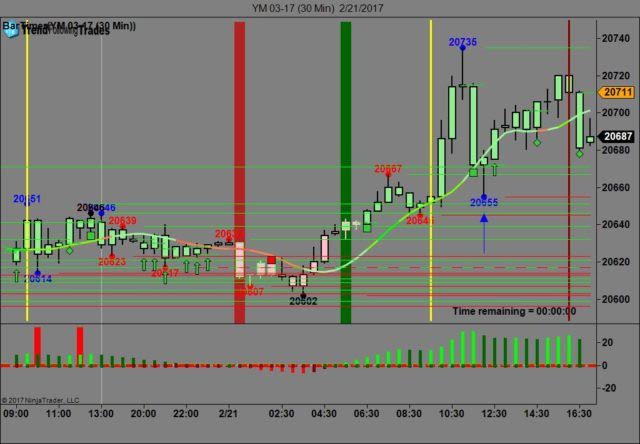
We’ve elected to switch gears a bit and show correlation between the 30 year bond (ZB) and The YM futures contract. The YM contract is the DJIA and the purpose is to show reverse correlation between the two instruments. Remember it’s liken to a seesaw, when up goes up the other should go down and vice versa.
Yesterday the ZB made it’s move at around 12 PM EST with no economic news in sight. The ZB hit a high at around that time and the YM hit a low. If you look at the charts below ZB gave a signal at around 12 PM and the YM was moving higher at the same time. Look at the charts below and you’ll see a pattern for both assets. ZB hit a high at around 12 PM EST and the YM hit a low. These charts represent the newest version of Trend Following Trades and I’ve changed the timeframe to a 30 minute chart to display better. This represented a shorting opportunity on the 30 year bond, as a trader you could have netted about 15 plus ticks per contract on this trade. Each tick is worth $31.25. We added a Donchian Channel to the charts to show the signals more clearly.
Charts Courtesy of Trend Following Trades built on a NinjaTrader platform.
Bias
Yesterday we gave the markets an upside bias as both the Bonds and Gold were trading lower yesterday morning and this is indicative of an upside day. The markets didn’t disappoint as the Dow traded higher by 119 points and the other indices gained ground as well. Today we are dealing with a nearly correlated market and it’s correlated to the upside hence our bias is to the upside.
Could this change? Of Course. Remember anything can happen in a volatile market.
Commentary
It seems that the markets are still adamant about going higher as yesterday was no exception to that rule. Yesterday’s bias was for an upside day and all we did was to follow our rules of Market Correlation which told us that there was a good chance that the markets would advance and they did. Today we have the FOMC Meeting Minutes out at 2 PM this afternoon and that will have an impact on today’s session. Of course time will tell how this works out…
Author

Nick Mastrandrea
Market Tea Leaves


