Markets Stage A Comeback

US Dollar: Sept USD is Up at 98.065.
Energies: Sept '19 Crude is Up at 55.24.
Financials: The Sept 30 year bond is Down 60 ticks and trading at 163.21.
Indices: The Sept S&P 500 emini ES contract is 80 ticks Higher and trading at 2911.50.
Gold: The Dec Gold contract is trading Down at 1511.50 Gold is 121 ticks Lower than its close.
Initial Conclusion
This is not a correlated market. The dollar is Up+ and Crude is Up+ which is not normal but the 30 year Bond is trading Lower. The Financials should always correlate with the US dollar such that if the dollar is lower then bonds should follow and vice-versa. The S&P is Higher and Crude is trading Higher which is not correlated. Gold is trading Lower which is correlated with the US dollar trading Up. I tend to believe that Gold has an inverse relationship with the US Dollar as when the US Dollar is down, Gold tends to rise in value and vice-versa. Think of it as a seesaw, when one is up the other should be down. I point this out to you to make you aware that when we don't have a correlated market, it means something is wrong. As traders you need to be aware of this and proceed with your eyes wide open.
Currently all of Asia is trading Higher. At this time all of Europe is trading Higher as well.
Possible Challenges To Traders Today
-
No Major Economic News.
-
Lack of Major Economic news
Treasuries
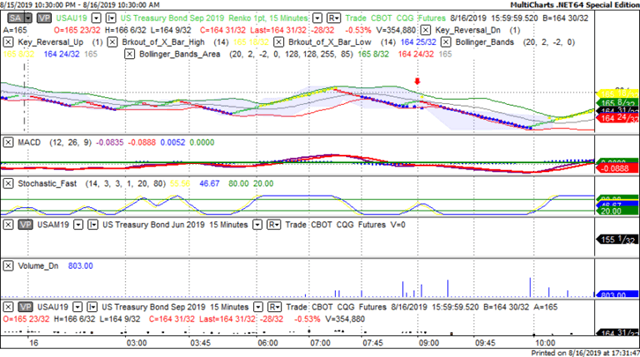
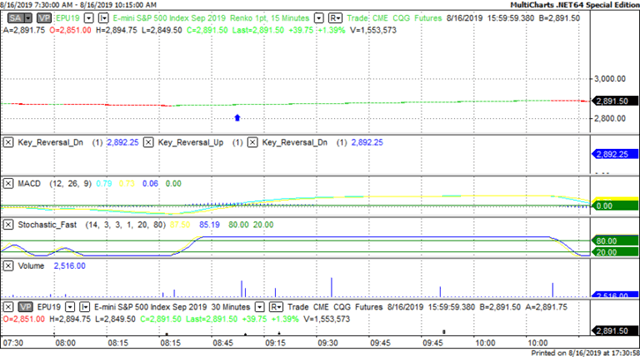
We've elected to switch gears a bit and show correlation between the 30 year bond (ZB) and The YM futures contract. The YM contract is the DJIA and the purpose is to show reverse correlation between the two instruments. Remember it's liken to a seesaw, when up goes up the other should go down and vice versa.
On Friday the ZB made a major move at around 9 AM EST. The ZB hit a High at around that time and the YM hit a Low. If you look at the charts below ZB gave a signal at around 9 AM EST and the YM was moving Higher at the same time. Look at the charts below and you'll see a pattern for both assets. ZB hit a High at around 9 AM and the YM was moving Higher at the same time. These charts represent the newest version of MultiCharts and I've changed the timeframe to a 15 minute chart to display better. This represented a Shorting opportunity on the 30 year bond, as a trader you could have netted about 30 ticks per contract on this trade. Each tick is worth $31.25. Please note: the front month for both the ZB and YM contract is now September, 2019 and I've changed the format to Renko bars such that it may be more apparent and visible.
Charts Courtesy of MultiCharts built on an AMP platform
Bias
On Friday we gave the markets an Upside bias as the Bonds and Gold were both trading Lower Friday morning and this usually reflects an Upside day. The markets didn't disappoint as the Dow rose by 307 points and the other indices gained ground as well. Today we aren't dealing with a correlated market and our bias is to the Upside.
Could this change? Of Course. Remember anything can happen in a volatile market.
Commentary
On Friday we didn't have much in the way of economic reports; at least not nearly as much as we saw on Thursday. However the major report was Building Permits which beat expectations. This alone affects so many different areas: employment, material purchases, appliances, etc. and the markets reacted favorably. Today we have no major economic news so the markets will be left to its own devices. Some may construe Friday as the proverbial Dead Cat Bounce but only time will tell is this is the case.
Author

Nick Mastrandrea
Market Tea Leaves


