Markets say no to the upside [Video]
![Markets say no to the upside [Video]](https://editorial.fxstreet.com/images/Markets/Currencies/Majors/DollarIndex/money-43062726_XtraLarge.jpg)
US Dollar: Dec '21 USD is Down at 94.325.
Energies: Nov '21 Crude is Down at 80.60.
Financials: The Dec '21 30 Year bond is Up 20 ticks and trading at 159.06.
Indices: The Dec '21 S&P 500 emini ES contract is 37 ticks Higher and trading at 4350.00.
Gold: The Dec'21 Gold contract is trading Up at 1768.50. Gold is 92 ticks Higher than its close.
Initial conclusion
This is not a correlated market. The dollar is Down and Crude is Down which is not normal but the 30 year Bond is trading Higher. The Financials should always correlate with the US dollar such that if the dollar is lower then bonds should follow and vice-versa. The S&P is Higher and Crude is trading Lower which is correlated. Gold is trading Higher which is correlated with the US dollar trading Down. I tend to believe that Gold has an inverse relationship with the US Dollar as when the US Dollar is down, Gold tends to rise in value and vice-versa. Think of it as a seesaw, when one is up the other should be down. I point this out to you to make you aware that when we don't have a correlated market, it means something is wrong. As traders you need to be aware of this and proceed with your eyes wide open. Currently Asia is trading Mixed with half the exchanges Higher and the other half Lower. All of Europe is trading Mixed as well.
Possible challenges to traders today
-
CPI is out at 8:30 AM EST. This is Major.
-
Core CPI is out at 8:30 AM EST. This is Major.
-
FOMC Meeting Minutes is out at 2 PM EST. This is Major.
-
30-y Bond Auction starts at 1 PM EST. This is Major.
Treasuries
Traders please note that we've changed the Bond instrument from the 30 year (ZB) to the 10 year (ZN). They work exactly the same.
We've elected to switch gears a bit and show correlation between the 10 year bond (ZN) and The S&P futures contract. The S&P contract is the Standard and Poor's and the purpose is to show reverse correlation between the two instruments. Remember it's liken to a seesaw, when up goes up the other should go down and vice versa.
Yesterday the ZN made it's move at around 9:45 AM EST. The ZN hit a Low at around that time and the S&P moved Lower. If you look at the charts below ZN gave a signal at around 9:45 AM EST and the S&P moved Higher at around the same time. Look at the charts below and you'll see a pattern for both assets. ZN hit a Low at around 9:45 AM EST and the S&P was moving Lower shortly thereafter. These charts represent the newest version of MultiCharts and I've changed the timeframe to a 15 minute chart to display better. This represented a Long opportunity on the 10 year note, as a trader you could have netted about 15 ticks per contract on this trade. Each tick is worth $15.625. Please note: the front month for the ZN is now Dec '21. The S&P contract is now Dec '21 as well. I've changed the format to Renko bars such that it may be more apparent and visible.
Charts Courtesy of MultiCharts built on an AMP platform

ZN - Dec 2021 - 10/12/21
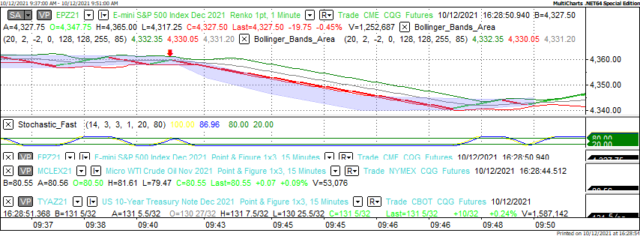
S&P - Dec 2021 - 10/12/21
Bias
Yesterday we gave the markets a Neutral bias as we didn't see any semblance of correlation Tuesday morning. The Dow closed 118 points Lower and the other indices lost ground as well. Today we aren't dealing with a correlated market and our bias is Neutral or Mixed.
Could this change? Of Course. Remember anything can happen in a volatile market.
Commentary
We have hoped for more of an Upside day yesterday but so such luck. The markets continued Lower and apparently the only thing going up was crude oil. Crude is now trading north of $80 a barrel and it hasn't been that high in 7 years. This also means that prices and inflation are creeping Higher. We keep hearing that higher prices are temporary but I stated long ago that once companies get used to higher prices and therefore higher profits; they are reluctant to give that up. What proof? In 2008 when crude was trading close to $150 a barrel, airlines imposed a luggage fee that they justified for higher oil prices. Has anyone in recent years seen them roll back those fees?? Anyone??? Enough said....
Author

Nick Mastrandrea
Market Tea Leaves


