Markets Rise Despite 'Attacks' [Video]
![Markets Rise Despite 'Attacks' [Video]](https://editorial.fxstreet.com/images/Markets/Currencies/Majors/DollarIndex/person-holds-dollar-bills-in-his-hand-gm510306130-86185787_XtraLarge.jpg)
US Dollar: June USD is Up at 97.085.
Energies: July '19 Crude is Down at 52.08.
Financials: The Sept 30 year bond is Up 15 ticks and trading at 154.23.
Indices: The June S&P 500 emini ES contract is 36 ticks Lower and trading at 2885.50.
Gold: The June Gold contract is trading Up at 1357.80. Gold is 143 ticks Higher than its close.
Initial Conclusion
This is not a correlated market. The dollar is Up+ and Crude is Down- which is normal and the 30 year Bond is trading Higher. The Financials should always correlate with the US dollar such that if the dollar is lower then bonds should follow and vice-versa. The S&P is Lower and Crude is trading Lower which is not correlated. Gold is trading Higher which is not correlated with the US dollar trading Up. I tend to believe that Gold has an inverse relationship with the US Dollar as when the US Dollar is down, Gold tends to rise in value and vice-versa. Think of it as a seesaw, when one is up the other should be down. I point this out to you to make you aware that when we don't have a correlated market, it means something is wrong. As traders you need to be aware of this and proceed with your eyes wide open.
Asia traded Mixed and all of Europe is trading Lower at this time.
Possible Challenges To Traders Today
-
Retail Sales is out at 8:30 AM EST. This is major.
-
Core Retail Sales is out at 8:30 AM EST. This is major.
-
Capacity Utilization Rate is out at 9:15 AM EST. This is major.
-
Industrial Production m/m is out at 9:15 AM EST. This is major.
-
Prelim UoM Consumer Sentiment is out at 10 AM EST. This is major.
-
Prelim UoM Inflation Expectations is out at 10 AM EST. This is major....
-
Business Inventories m/m is out at 10 AM EST.
Treasuries
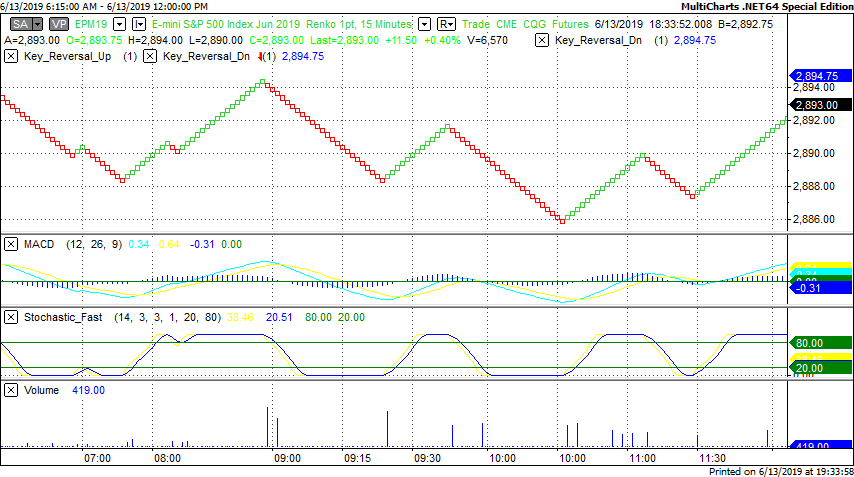
We've elected to switch gears a bit and show correlation between the 30 year bond (ZB) and The YM futures contract. The YM contract is the DJIA and the purpose is to show reverse correlation between the two instruments. Remember it's liken to a seesaw, when up goes up the other should go down and vice versa.
Yesterday the ZB made a major move at around 8:30 AM EST. The ZB hit a Low at around that time and the YM hit a High. If you look at the charts below ZB gave a signal at around 8:30 AM EST and the YM was moving Lower at the same time. Look at the charts below and you'll see a pattern for both assets. ZB hit a Low at around 8:30 AM and the YM was moving Lower at the same time. These charts represent the newest version of MultiCharts and I've changed the timeframe to a 15 minute chart to display better. This represented a Long opportunity on the 30 year bond, as a trader you could have netted about a dozen ticks per contract on this trade. Each tick is worth $31.25. Please note: the front month for the ZB contract is now September, 2019 and I've changed the format to Renko bars such that it may be more apparent and visible.
Charts Courtesy of MultiCharts built on an AMP platform.
-636961096010164511.png)
Bias
Yesterday we gave the markets a Neutral bias but the markets decided to rise after two back to back losses. The Dow closed 102 points Higher and the other indices traded Higher as well. Today we aren't dealing with a correlated market and our bias is to the Downside.
Could this change? Of Course. Remember anything can happen in a volatile market.
Commentary
On Wednesday evening we heard a news report that a couple of oil tankers was "attacked" in the Gulf region. At first I paid no mind to it but yesterday the markets rose despite the fact that a couple of oil tankers were "attacked". I use that term loosely because it wasn't a military attack, it was more sabotage as opposed to anything else yet no one knows how or who was behind the attack. In the old days the markets would shake at such news yet this time around, the markets rose which is highly unusual. Time will tell how this all plays out...
Author

Nick Mastrandrea
Market Tea Leaves


