Markets remain under pressure with negative risk appetite

Market Overview
A wave of selling pressure has hit US markets with the negative risk appetite amidst the increasing concern over the implications of the latest calamity to hit Donald Trump’s White House. Realistic discussions of impeachment are now being had and markets are rightly concerned that this is another significant spanner in the works for Trump’s legislative plans. If he struggled with healthcare reform how is he going to get through controversial plans over huge fiscal stimulus, banking reform and deregulation? Treasury yields have tumbled, leading to significant dollar weakness. The VIX has jumped to over 15 having been below 10 a little more than a week ago. Equities have been sold off too. There is though a potential calming impact with the appointment of former FBI Director Robert Mueller as a special counsel for the Russia investigation. This seems to have driven a mild rebound in Treasury yields this morning and the dollar has stabilised. Global equities are still under pressure, but are they set for a bounce too as the bargain hunters move in?

Wall Street closed sharply down with the S&P 500 -1.8% at 2357, whilst Asian markets have also been under pressure with the Nikkei -1.3% on the significant strength of the yen. European indices are lower in early moves. Forex markets show a degree of stability for the dollar today with the greenback performing well across the major currencies. The yen is unwinding yesterday’s gains despite Japan GDP growth for Q1 coming in better than expected with annualised growth of 2.2% (beating the 1.7% expected). One currency outperformer though is the Aussie dollar after positive Australian employment data, with falling unemployment to 5.7% (5.9% exp) but also better participation rate and increased employment. Gold is seeing a degree of profit taking and is marginally lower, whilst oil is also slightly off.
With inflation going up and UK earnings growth falling away, the focus will certainly be on the impact on UK Retail Sales at 0930BST. After falling away sharply in the past few months (as inflation has started to spike higher), expectations is for ex-fuel retail sales to tick mildly lower to +2.5% (from +2.6% last month). US Weekly Jobless Claims at 1330BST are expected to be 240,000 (236,000 last week), whilst after the Empire State Manufacturing dropped to negative earlier in the week there will be added attention on the Philly Fed Business Index at 1500BST expected to only dip slightly to 19.5 (from last month’s 22.0). ECB President Mario Draghi is due to speak at 1800BST.
Chart of the Day – DAX Xetra
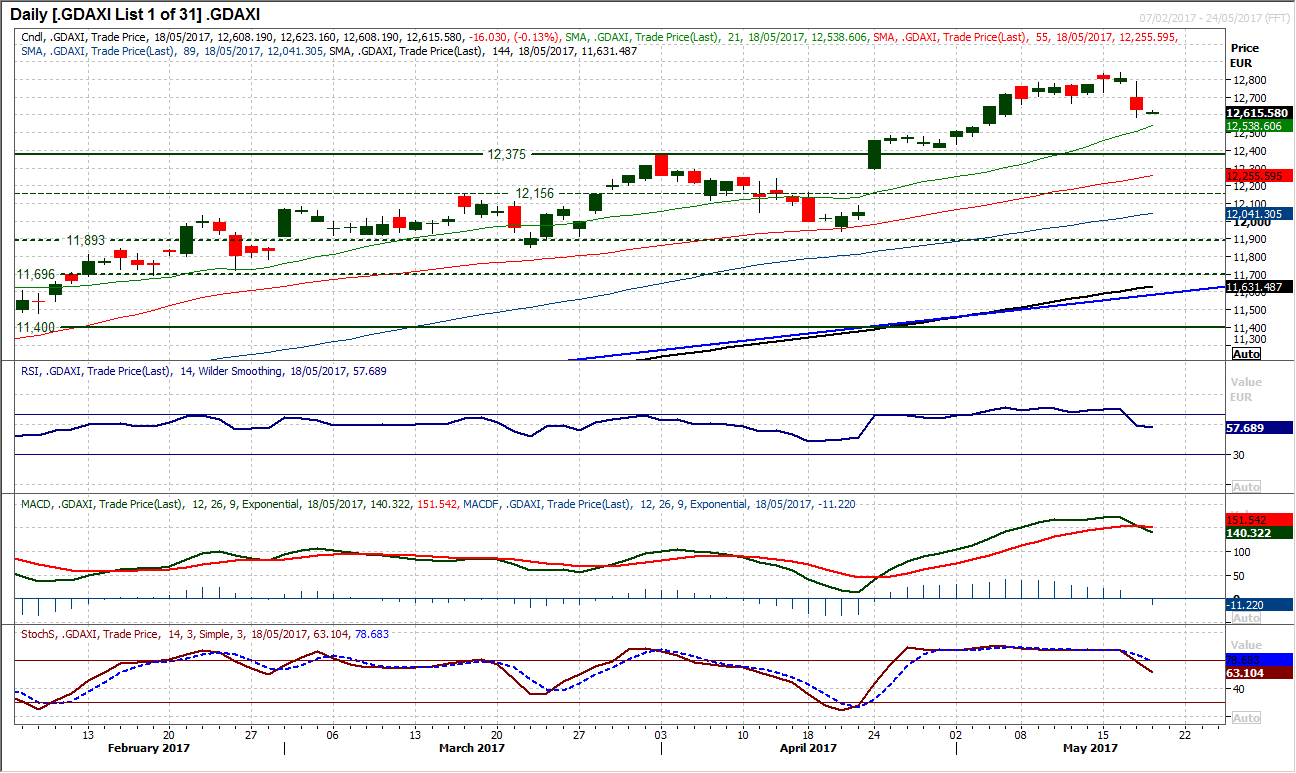
Equities are under pressure as a sharp reversal in sentiment has kicked in. This is reflected in a deterioration in the technical as the market has peaked at 12,841. The concern is that after the opening gap lower rallied to fill the intraday gap yesterday, the bears resumed control to sell the market down into the close. The market has also now breached the near term support at 12,662. Whilst there is no obvious pattern breakdown, the market could take the strength of yesterday’s bear candle to turn corrective for the near term at least. The potential is now growing for a retracement back towards the key breakout support at 12,375. The momentum indicators are now deteriorating with the MACD and Stochastics lines crossing lower. There is room for the RSI now to unwind back to 40/50 which is where the near term corrective moves tend to return to. The hourly cahrt shows the market is now into a more corrective mind-set on momentum, meaning that resistance in the 12,662/12,700 is a chance to sell.
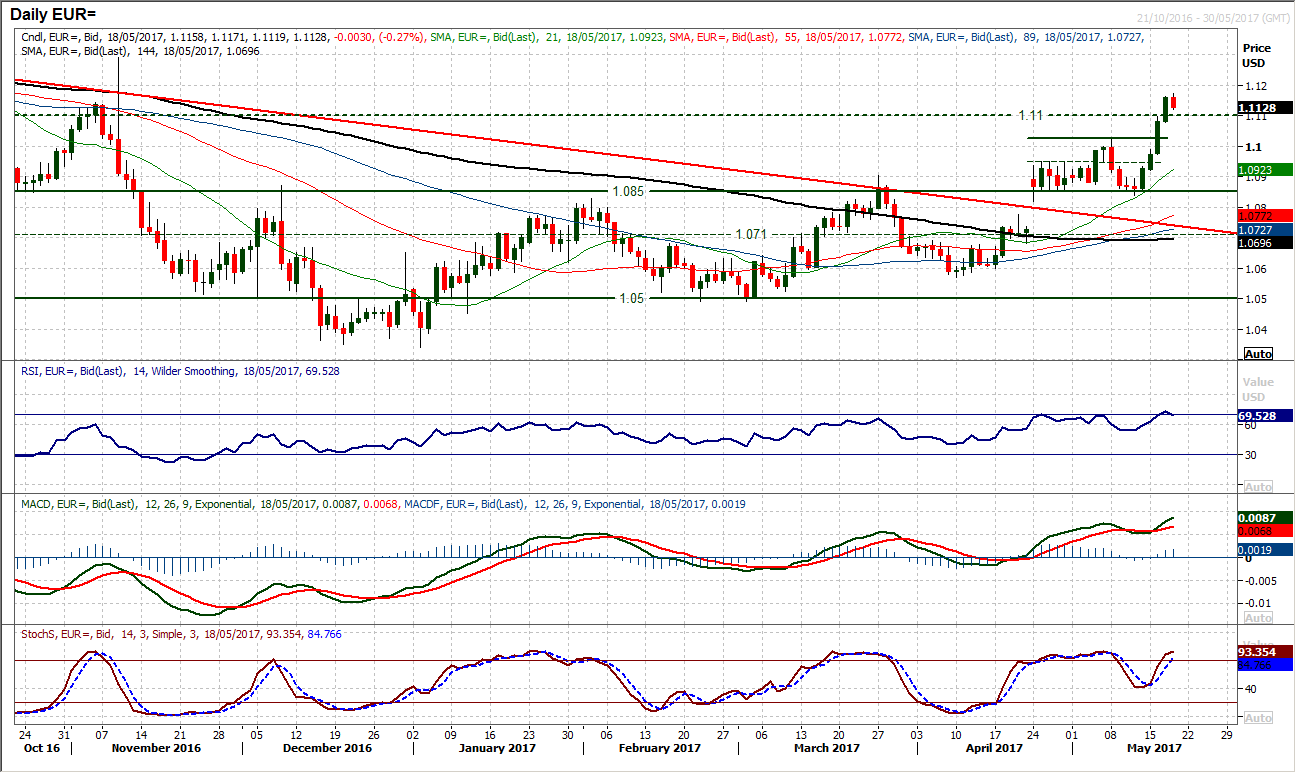
The euro has rallied hard with the dollar under significant selling pressure. Four strong bull candles in a row have burst through a range of resistance levels with the latest being the longer term pivot at $1.1100. There is an implied target of $1.1190 from the recent three week range breakout which remains within reach. However, the bulls will be mindful of the RSI which at over 70 is historically stretched. This means that once the momentum of the political risk for the dollar begins to subside there could easily be a move to unwind the momentum. There is now support at the $1.1100 pivot and the breakout support around $1.1020. The hourly chart remains positively configured but there is a sense of a slight negative divergence beginning to build on the RSI and MACD lines. This could be the precursor to a slowing of the trend higher and perhaps some profit taking soon. Initial support is $1.1080/$1.1120. Resistance is the overnight high at $1.1170 before resistance from September between $1.1200/$1.1280.
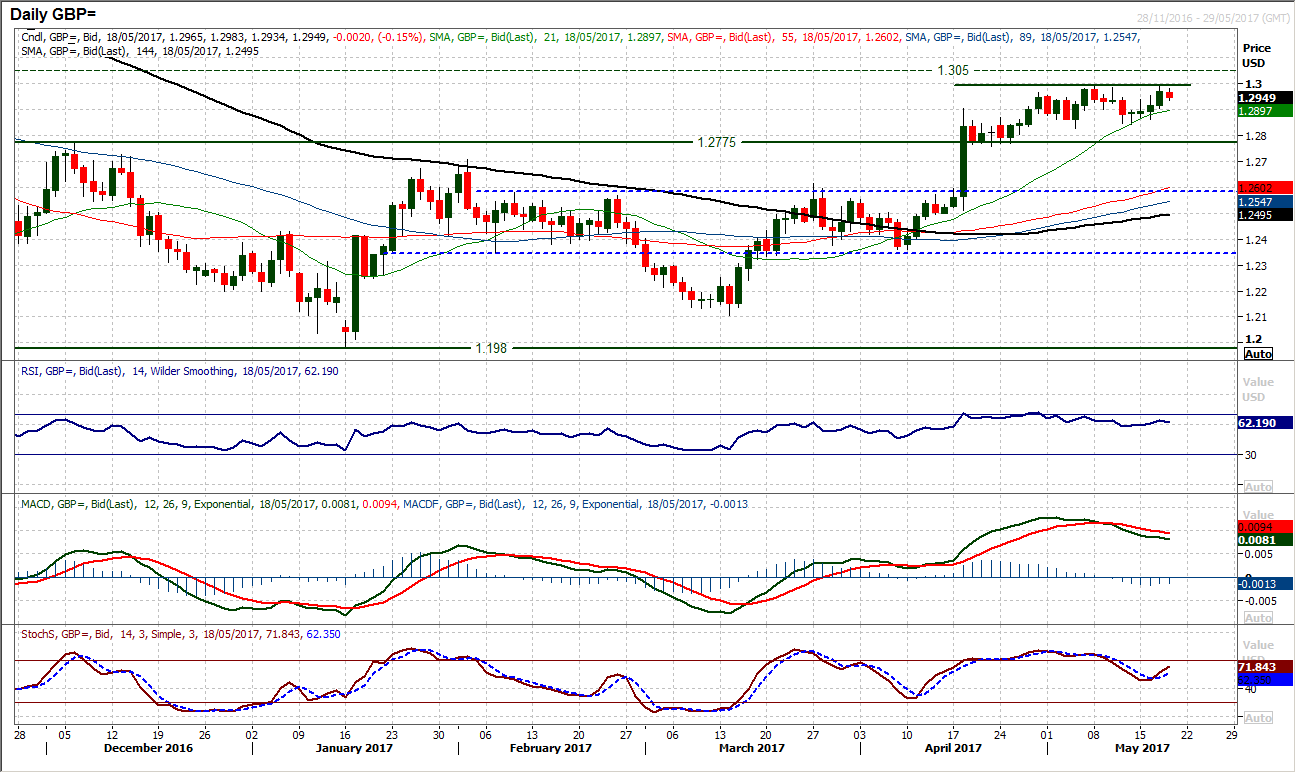
Can Cable breakout again? The resistance at $1.2990 from earlier this month is still intact as yesterday’s rally failed to the pip and the early moves today reflect an uncertainty. The dollar has been under pressure and Cable has been rising, but still there has not been a breakout of the recent range. There is a bullish bias within the range which points to increasing pressure, but as yet no move. The momentum indicators are positively configured with the Stochastics turning up again, the RSI consistently above 60 and the MACD lines seeming to bottom again way above neutral. However, despite the gains in the past couple of days, the hourly chart reflects more of a range play. The hourly RSI remains below 70 whilst the hourly MACD lines seem set to roll over again as the market fails at $1.2990. There is though a pivot support around $1.2940 to use as a basis for the bulls to push higher again. A closing breakout above $1.2990 would open further gains towards a test of $1.3050.
USD/JPY
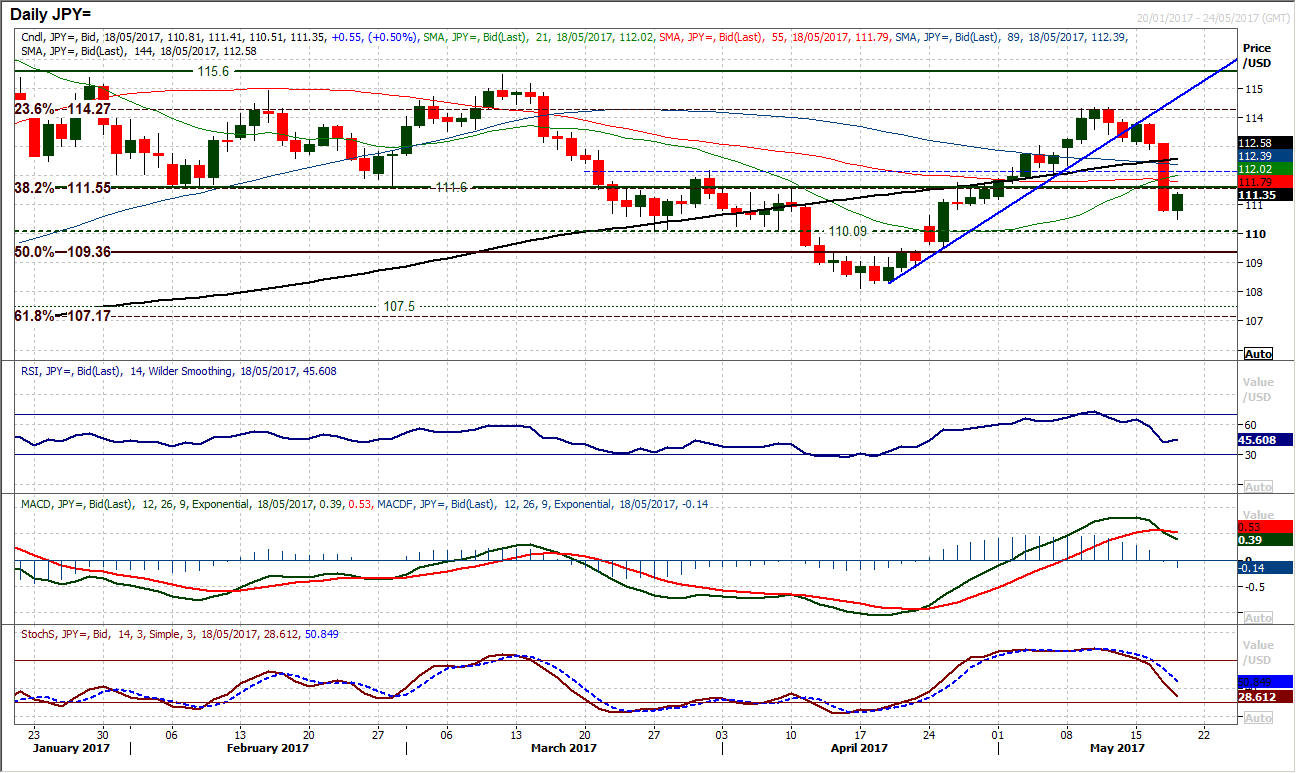
A huge strong bear candle posted yesterday has destroyed the bullish outlook now for the medium term. The move has driven corrective signals on Stochastics and MACD lines whilst the market is again trading below all the moving averages. However, after such a strong bear candle there can often be a reaction to unwind some of the previous session’s excesses. This seems to be happening today with the support from 110.50. However, having so decisively breached the support at 111.60/112.20 this medium term pivot range now becomes a basis of resistance today. The hourly chart shows some very near term rebound signals with the hourly Stochastics and MACD crossing higher. How the market deals with the resistance band 111.60/112.20 now becomes key as this is likely to be an area of overhead supply. A rebound failure would likely see the market drifting back towards 110.10 support.
Gold
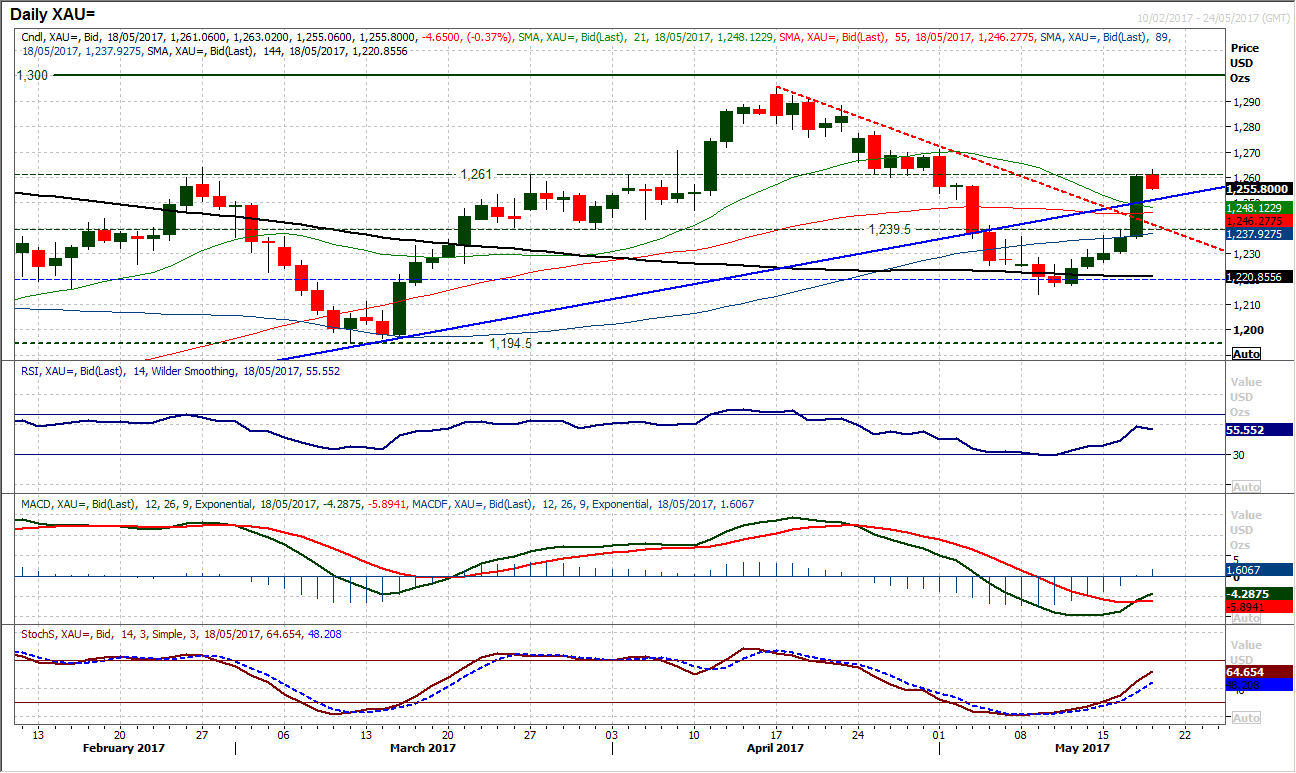
The bulls smashed their way to posting a hugely strong positive candle yesterday. The resistance of the confluence of trend lines stacked in the range between $1240/$1250 proved to be little problem. The momentum indicators have all understandably turned higher with the Stochastics rising strongly and the RSI above 50, whilst the MACD lines also crossing higher. However there is one final stumbling block that is preventing a bullish outlook from seeming sustainable. The resistance at $1261 which had been a key pivot throughout February to April is once more back in play. This seems to be holding back the bulls as a consolidation point now. A closing breakout above $1263 would reopen the way to the highs again at $1295, however looking on the hourly chart there is a consideration being given to this old pivot. The momentum indicators are just tuning lower and the market drifting. A breach of support around $1255 could start a deeper correction back towards $1240/$1245.
WTI Oil
Oil has formed support despite EIA inventories slightly higher than expected levels on crude, however, the technicals are likely to quickly regain the outlook. The recent rebound high at $49.66 on Monday which firmed up the pivot as a basis of resistance is once more a key test. The bulls would be looking to re-engage with the momentum indicators still tracking higher, however there is still a sense that the momentum has begun to struggle a touch. There is still a significant overhead resistance band $49.60/$50.20 to overcome and lies in the way of continued recovery. Yesterday’s peak of $49.50 before the market drifted back shows how much this resistance is on the minds of traders and will again be a key factor today. The hourly chart shows how Tuesday’s low around $48.00 is now a key near term support.

Dow Jones Industrial Average
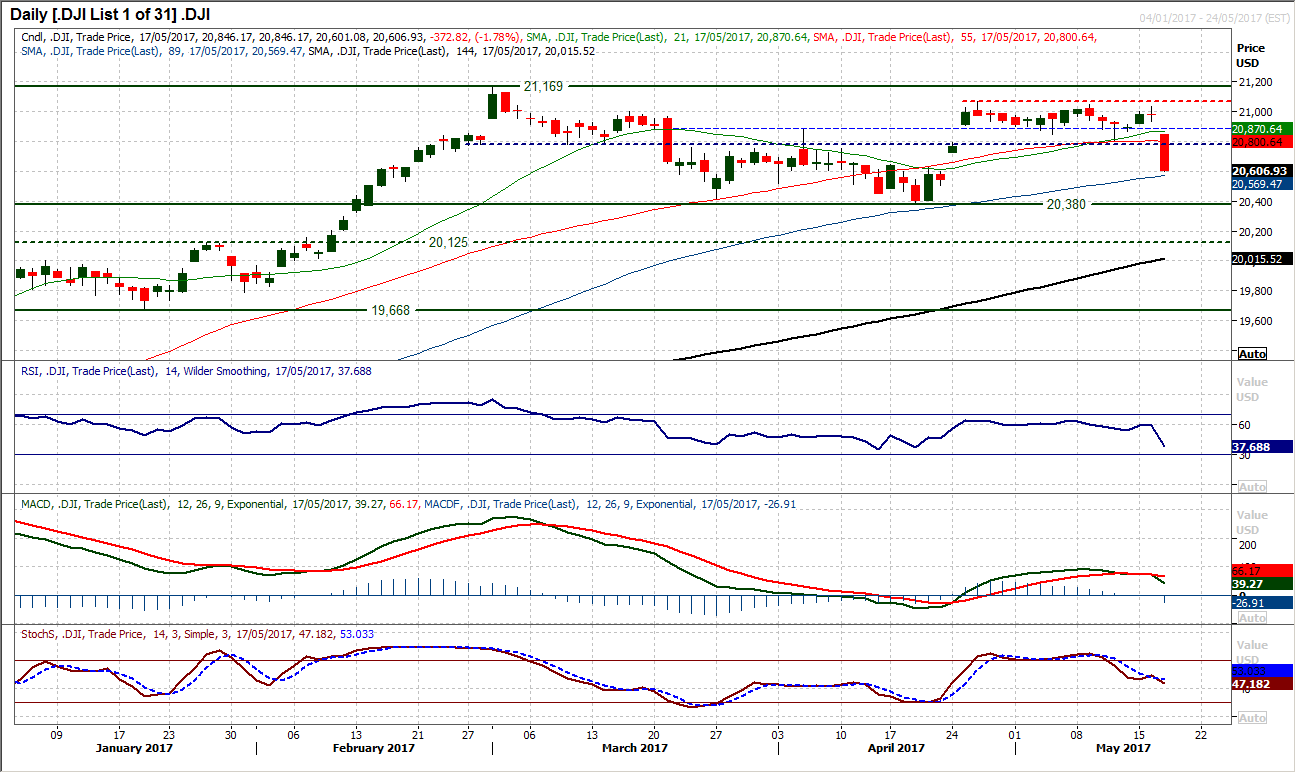
After weeks of limited moves on Wall Street, the sellers have suddenly grasped control with a sharp move to the downside. A breach of the support at 20,799 now opens the downside. The move completes a small top pattern that implies around 235 ticks of downside towards 20,570, a target that has already all but been hit by yesterday’s dramatic decline. The breach of 20,799 also takes the market below a medium term pivot which puts more of a corrective outlook on the chart but also means that the Dow is a range trade between 20,380/21,169. The momentum indicators have taken a turn for the worse with the RSI back below 40, the MACD lines crossing lower and a “bear kiss” on the Stochastics. The reaction of the bulls today will be interesting, as often in the wake of such a huge sell-off there will be a knee-jerk reaction higher. How the bulls react to buying pressure will be key to the outlook now near term. The hourly chart shows initial resistance 20,690/20,750 whilst there is now overhead supply now between 20,799/20,888 as a band of resistance with momentum now more correctively configured. The next support that protects from a full move to the range lows comes in at 20,520.
Author

Richard Perry
Independent Analyst


