Markets Make a U Turn [Video]
![Markets Make a U Turn [Video]](https://editorial.fxstreet.com/images/Markets/Equities/shares-certificate-7851553_XtraLarge.jpg)
Good Morning Traders,
As of this writing 5:30 AM EST, here's what we see:
US Dollar: Sept USD is Up at 96.905.
Energies: Aug '19 Crude is Up at 56.80.
Financials: The Sept 30 year bond is Up 8 ticks and trading at 155.00.
Indices: The Sept S&P 500 emini ES contract is 25 ticks Higher and trading at 2983.50.
Gold: The Aug Gold contract is trading Down at 1426.00. Gold is 8 ticks Lower than its close.
Initial Conclusion
This is not a correlated market. The dollar is Up+ and Crude is Up+ which is not normal and the 30 year Bond is trading Higher as well. The Financials should always correlate with the US dollar such that if the dollar is lower then bonds should follow and vice-versa. The S&P is Higher and Crude is trading Higher which is not correlated. Gold is trading Lower which is correlated with the US dollar trading Up. I tend to believe that Gold has an inverse relationship with the US Dollar as when the US Dollar is down, Gold tends to rise in value and vice-versa. Think of it as a seesaw, when one is up the other should be down. I point this out to you to make you aware that when we don't have a correlated market, it means something is wrong. As traders you need to be aware of this and proceed with your eyes wide open.
Currently all of Asia is trading Lower. Conversely all of Europe is trading Higher.
Possible Challenges To Traders Today
-
No major economic news.
-
Lack of major economic news.
Treasuries
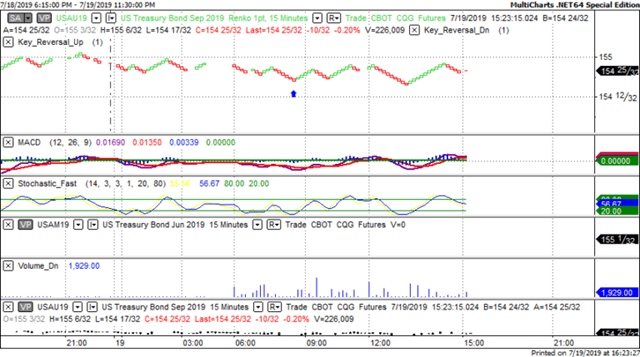
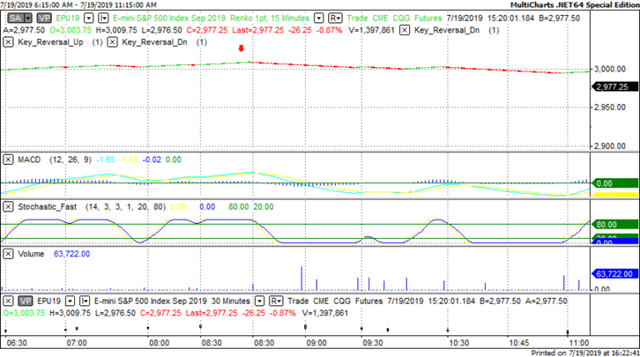
We've elected to switch gears a bit and show correlation between the 30 year bond (ZB) and The YM futures contract. The YM contract is the DJIA and the purpose is to show reverse correlation between the two instruments. Remember it's liken to a seesaw, when up goes up the other should go down and vice versa.
On Friday the ZB made a major move at around 8:30 AM EST. The ZB hit a Low at around that time and the YM hit a High. If you look at the charts below ZB gave a signal at around 8:30 AM EST and the YM was moving Lower at the same time. Look at the charts below and you'll see a pattern for both assets. ZB hit a Low at around 8:30 AM and the YM was moving Lower at the same time. These charts represent the newest version of MultiCharts and I've changed the timeframe to a 15 minute chart to display better. This represented a Long opportunity on the 30 year bond, as a trader you could have netted about 10 ticks per contract on this trade. Each tick is worth $31.25. Please note: the front month for both the ZB and YM contract is now September, 2019 and I've changed the format to Renko bars such that it may be more apparent and visible.
Charts Courtesy of MultiCharts built on an AMP platform
Bias
On Friday our bias was Neutral which means the markets could go in any direction. The Dow dropped 69 points and the other indices lost ground as well. Today we aren't dealing with a correlated market and our bias is Neutral.
Could this change? Of Course. Remember anything can happen in a volatile market.
Commentary
On Friday we gave the markets a Neutral bias which means it could go in any direction and did. Initially the markets migrated higher and stayed in positive territory until about 3 PM and then changed direction and migrated Lower. Why? The markets are expecting a 50 basis point reduction in interest rates and now the rumor mill is saying that it will only be 25 basis points or one quarter of one full point.
Author

Nick Mastrandrea
Market Tea Leaves


