Markets Make a U Turn
US Dollar: Mar. USD is Up at 89.770.
Energies: April '18 Crude is Down at 62.66.
Financials: The Mar 30 year bond is Up 8 ticks and trading at 143.12.
Indices: The Mar S&P 500 emini ES contract is 18 ticks Higher and trading at 2716.00.
Gold: The April gold contract is trading Down at 1330.80. Gold is 18 ticks Lower than its close.
Initial Conclusion
This is not a correlated market. The dollar is Up+ and Crude is Down- which is normal and the 30 year Bond is trading Higher. The Financials should always correlate with the US dollar such that if the dollar is lower then bonds should follow and vice-versa. The S&P is Higher and Crude is trading Down- which is correlated. Gold is trading Down- which is correlated with the US dollar trading Up+. I tend to believe that Gold has an inverse relationship with the US Dollar as when the US Dollar is down, Gold tends to rise in value and vice-versa. Think of it as a seesaw, when one is up the other should be down. I point this out to you to make you aware that when we don't have a correlated market, it means something is wrong. As traders you need to be aware of this and proceed with your eyes wide open.
At this hour all of Asia is trading Higher. As of this writing Europe is trading Mixed with half the exchanges Higher and the other half Lower.
Possible Challenges To Traders Today
-
FOMC Member Dudley Speaks 10:15 AM EST. This is major.
-
Fed Monetary Policy Report is out at 11 AM. This is major.
-
FOMC Member Mester Speaks is out at 1:30 PM. This is major.
-
FOMC Member Williams Speaks at 3:40 PM EST. This is major.
Treasuries
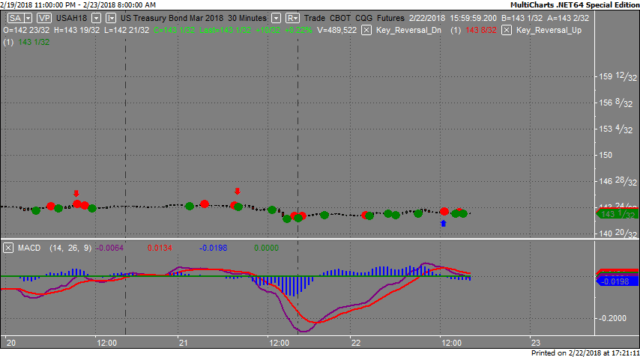
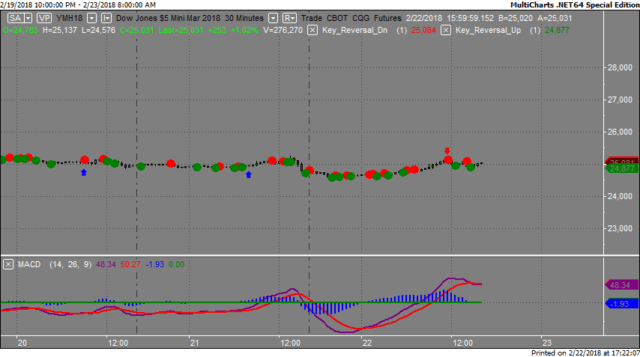
We've elected to switch gears a bit and show correlation between the 30 year bond (ZB) and The YM futures contract. The YM contract is the DJIA and the purpose is to show reverse correlation between the two instruments. Remember it's liken to a seesaw, when up goes up the other should go down and vice versa.
Yesterday the ZB made it's move at around 12 PM. The ZB hit a Low at around that time and the YM hit a High. If you look at the charts below ZB gave a signal at around 12 PM EST and the YM was moving Lower at the same time. Look at the charts below and you'll see a pattern for both assets. ZB hit a Low at around 12 PM and the YM hit a High. These charts represent the newest version of MultiCharts and I've changed the timeframe to a 30 minute chart to display better. This represented a Long opportunity on the 30 year bond, as a trader you could have netted about a dozen ticks per contract on this trade. Each tick is worth $31.25.
Charts Courtesy of MultiCharts built on an AMP platform.
Bias
Yesterday we gave the markets a Downside bias as the USD and Bonds were both trading Higher yesterday morning and this usually doesn't bode well for an Upside day, hence the bias was to the Downside. The markets however had other ideas as the Dow gained 165 points, the S&P gained 3 but the Nasdaq dropped 8 points. Today we aren't dealing with a correlated market and our bias is Neutral.
Could this change? Of Course. Remember anything can happen in a volatile market.
Commentary
Yesterday morning we gave the markets a Downside bias as both the USD and Bonds were all trading Higher Thursday morning and this typically reflects a downside bias. The markets however had other ideas as both the Dow and S&P closed Higher but the Nasdaq lost about 8 points. As we state each and every day "this could change". It seems that after 3 days of losses the Smart Money pushed the markets higher. Today we have no less than 3 FOMC Members speaking and that could pose a challenge to the markets today as there really isn't any other economic reports to rely on.
Author

Nick Mastrandrea
Market Tea Leaves


