Markets finish mixed

US Dollar: Dec '22 USD is Up at 114.550.
Energies: Nov '22 Crude is Down at 78.24.
Financials: The Dec '22 30 Year bond is Down 22 ticks and trading at 124.04.
Indices: The Dec '22 S&P 500 emini ES contract is 172 ticks Lower and trading at 3618.00.
Gold: The Dec'22 Gold contract is trading Down at 1624.30. Gold is 123 ticks Lower than its close.
Initial conclusion
This is not a correlated market. The dollar is Up, and Crude is Down which is normal, but the 30-year Bond is trading Lower. The Financials should always correlate with the US dollar such that if the dollar is lower, then the bonds should follow and vice-versa. The S&P is Lower, and Crude is trading Lower which is not correlated. Gold is trading Lower which is correlated with the US dollar trading Up. I tend to believe that Gold has an inverse relationship with the US Dollar as when the US Dollar is down, Gold tends to rise in value and vice-versa. Think of it as a seesaw, when one is up the other should be down. I point this out to you to make you aware that when we don't have a correlated market, it means something is wrong. As traders you need to be aware of this and proceed with your eyes wide open. All of Asia is trading Lower at the present time. All of Europe is trading Lower as well.
Possible challenges to traders today
-
Goods Trade Balance is out at 8:30 AM EST. This is Major.
-
Prelim Wholesale Inventories is out at 8:30 AM EST. Major.
-
Pending Home Sales is out at 10 AM EST. Major
-
FOMC Member Bullard Speaks at 10:10 AM EST. Major.
-
Fed Chair Powell Speaks at 10:15 AM EST. Major.
-
Crude Oil Inventories is out at 10:30 AM EST. Major.
-
FOMC Member Bowman Speaks at 11 AM EST. Major.
Treasuries
Traders, please note that we've changed the Bond instrument from the 30 year (ZB) to the 10 year (ZN). They work exactly the same.
We've elected to switch gears a bit and show correlation between the 10-year bond (ZN) and the S&P futures contract. The S&P contract is the Standard and Poor's, and the purpose is to show reverse correlation between the two instruments. Remember it's likened to a seesaw, when up goes up the other should go down and vice versa.
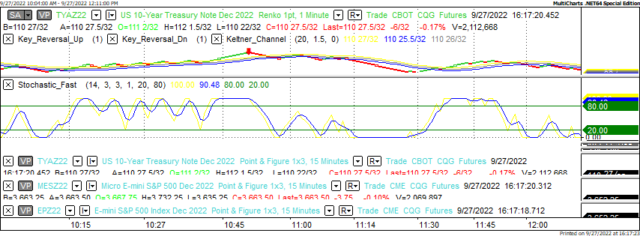
Yesterday the ZN made its move at around 10:40 AM EST. The ZN hit a High at around that time and the S&P moved Higher at around the same time. If you look at the charts below ZN gave a signal at around 10:40 AM and the S&P moved Higher at around the same time. Look at the charts below and you'll see a pattern for both assets. ZN hit a Low at around 10:40 AM and the S&P was moving Higher shortly thereafter. These charts represent the newest version of MultiCharts and I've changed the timeframe to a 15-minute chart to display better. This represented a Short opportunity on the 10-year note, as a trader you could have netted about 20 plus ticks per contract on this trade. Each tick is worth $15.625. Please note: the front month for the ZN is now Dec '22. The S&P contract is also Dec' 22. I've changed the format to Renko Bars such that it may be more apparent and visible.
Charts courtesy of MultiCharts built on an AMP platform
ZN - Dec 2022 - 09/27/22
-637999590487540589.png)
S&P - Dec 2022 - 9/27/22
Bias
Yesterday we gave the indices an Upside bias as the USD was down and the indices were trading Higher Tuesday morning. The markets closed Mixed as the Dow was down by 126 points, the S&P down by 8 points but the Nasdaq rose 27 points on the session. Today we aren't dealing with a correlated market and our bias is Neutral.
Could this change? Of Course. Remember anything can happen in a volatile market.
Commentary
It would appear as though the markets are continuing to suffer due to fear of recession. As we explained previously traders on the street are concerned that the Fed will tighten too quickly with a lrger than expected rate hike. Yesterday we felt certain that the markets would trend Higher after 6 sessions of down markets. Prior to 12 noon this would be correct as the indices did trade Higher but then collapsed as the session wore on. The bright spot is that at least the Nasdaq did trade Higher. What the markets need is some kind of reassurance that rates will stabilize, and that recession can be avoided. Someone like Fed Chair Powell might do.
Author

Nick Mastrandrea
Market Tea Leaves


