Markets dive lower [Video]
![Markets dive lower [Video]](https://editorial.fxstreet.com/images/TechnicalAnalysis/Intermarket/Correlation/it-must-work-gm537868515-58464346_XtraLarge.jpg)
US Dollar: Dec '22 USD is Down at 105.205.
Energies: Jan '23 Crude is Down at 76.10.
Financials: The Mar '23 30 Year T-Bond is Up 13 ticks and trading at 129.07.
Indices: The Dec '22 S&P 500 Emini ES contract is 9 ticks Lower and trading at 4001.00.
Gold: The Feb'23 Gold contract is trading Up at 1787.00. Gold is 57 ticks Higher than its close.
Initial conclusion
This is not a correlated market. The dollar is Down, and Crude is Down which is not normal, but the 30 Year T-Bond is trading Lower. The Financials should always correlate with the US dollar such that if the dollar is lower, then the bonds should follow and vice-versa. The S&P is Higher, and Crude is trading Lower which is correlated. Gold is trading Higher which is correlated with the US dollar trading Down. I tend to believe that Gold has an inverse relationship with the US Dollar as when the US Dollar is down, Gold tends to rise in value and vice-versa. Think of it as a seesaw, when one is up the other should be down. I point this out to you to make you aware that when we don't have a correlated market, it means something is wrong. As traders you need to be aware of this and proceed with your eyes wide open. Currently Asia is trading Mixed with half the exchanges Higher and the other half Lower. Currently all of Europe is trading Lower.
Possible challenges to traders today
-
Trade Balance is out at 8:30 AM EST. This is Major.
-
Lack of major economic news.
Treasuries
Traders, please note that we've changed the Bond instrument from the 30 year (ZB) to the 10 year (ZN). They work exactly the same.
We've elected to switch gears a bit and show correlation between the 10-year bond (ZN) and the S&P futures contract. The S&P contract is the Standard and Poor's, and the purpose is to show reverse correlation between the two instruments. Remember it's likened to a seesaw, when up goes up the other should go down and vice versa.
Yesterday the Bonds hit a High at around 10:20 AM EST. The S&P hit a Low at around that time and the Bonds moved Lower shortly thereafter. If you look at the charts below ZN gave a signal at around 10:20 AM and the S&P gave a signal at around the same time. Look at the charts below and you'll see a pattern for both assets. ZN hit a High at around 10:20 AM and the S&P moved Higher shortly thereafter. These charts represent the newest version of MultiCharts and I've changed the timeframe to a 15-minute chart to display better. This represented a Short opportunity on the 10-year note, as a trader you could have netted about a dozen plus ticks per contract on this trade. Each tick is worth $15.625. Please note: the front month for the ZN is now Dec '22. The S&P contract is also Dec' 22. I've changed the format to Renko Bars such that it may be more apparent and visible.
Charts courtesy of MultiCharts built on an AMP platform
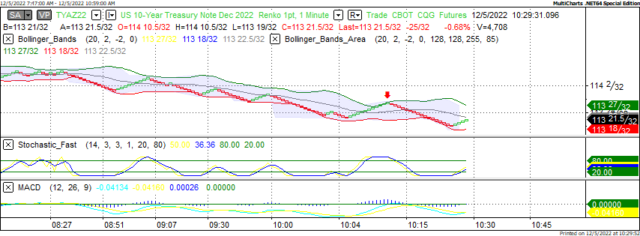
ZN - Dec 2022 - 12/05/22
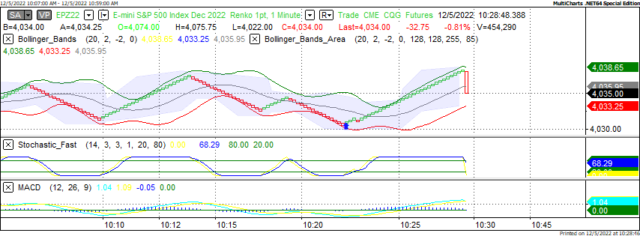
S&P - Dec 2022 - 12/05/22
Bias
Yesterday we gave the markets a Downside bias as the USD, the Bonds and Crude were trading Higher yesterday morning, and this represents a Downside Day. The markets didn't disappoint as the Dow dropped 483 points and the indices dropped as well. Today we aren't dealing with a correlated market and our bias is Neutral or Mixed.
Could this change? Of Course. Remember anything can happen in a volatile market.
Commentary
Yesterday we didn't have any earth-shattering economic news to drive the markets with the exception that OPEC will maintain it's status quo on oil production and will not increase supply. This was neither here nor there. The fact is the markets were correlated to the Downside and down they went. All the indices lost ground yesterday so it wasn't a Mixed Day or a day where some indices could gain while others couldn't. Today we don't have much in terms of economic news so the markets will be left to its own devices. Will this drive the markets Higher? Only time will tell on that one.
Author

Nick Mastrandrea
Market Tea Leaves


