Markets Dip…slightly
US Dollar: March USD is Down at 95.205.
Energies: Feb '19 Crude is Down at 50.98.
Financials: The Mar 30 year bond is Up 11 ticks and trading at 146.03.
Indices: The Mar S&P 500 emini ES contract is 75 ticks Lower and trading at 2576.50.
Gold: The Feb Gold contract is trading Up at 1293.90. Gold is 44 ticks Higher than its close.
Initial Conclusion
This is not a correlated market. The dollar is Down- and Crude is Down- which is not normal but the 30 year Bond is trading Higher. The Financials should always correlate with the US dollar such that if the dollar is lower then bonds should follow and vice-versa. The S&P is Lower and Crude is trading Lower which is not correlated. Gold is trading Higher which is correlated with the US dollar trading Lower. I tend to believe that Gold has an inverse relationship with the US Dollar as when the US Dollar is down, Gold tends to rise in value and vice-versa. Think of it as a seesaw, when one is up the other should be down. I point this out to you to make you aware that when we don't have a correlated market, it means something is wrong. As traders you need to be aware of this and proceed with your eyes wide open.
At this hour Asia is trading mainly Lower with the exception of the Nikkei exchange which is Lower at this time. Currently all of Europe is trading to the Downside.
Possible Challenges To Traders Today
-
No major economic news to speak of.
-
Lack of major economic news.
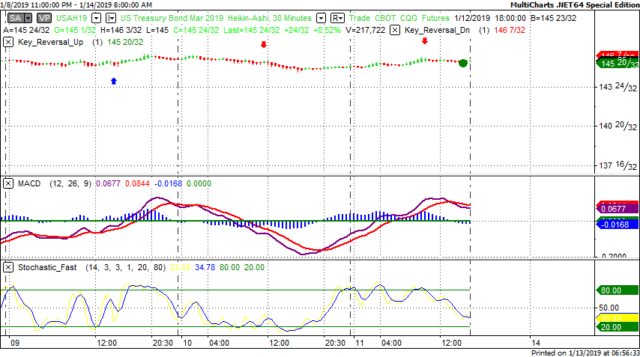
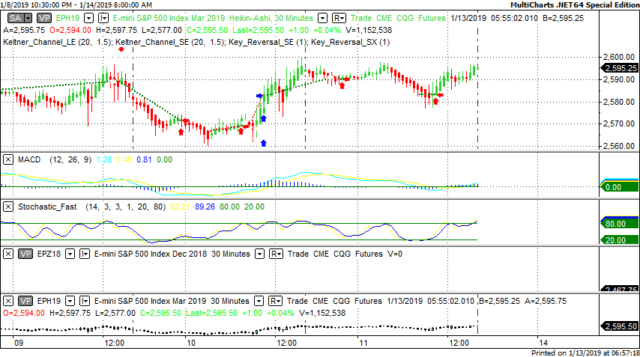
Treasuries
We've elected to switch gears a bit and show correlation between the 30 year bond (ZB) and The YM futures contract. The YM contract is the DJIA and the purpose is to show reverse correlation between the two instruments. Remember it's liken to a seesaw, when up goes up the other should go down and vice versa.
On Friday the ZB made a major move at around 10:30 AM EST. The ZB hit a High at around that time and the YM hit a Low. If you look at the charts below ZB gave a signal at around 10:30 AM EST and the YM was moving Higher at the same time. Look at the charts below and you'll see a pattern for both assets. ZB hit a High at around 10:30 AM and the YM was moving Higher at the same time. These charts represent the newest version of MultiCharts and I've changed the timeframe to a 30 minute chart to display better. This represented a Shorting opportunity on the 30 year bond, as a trader you could have netted about a dozen ticks per contract on this trade. Each tick is worth $31.25. Please note: the front month for the ZB contract is now March, 2019
Charts Courtesy of MultiCharts built on an AMP platform.
Bias
On Friday we gave the markets a Neutral bias as the indices didn't have much in the way of correlation Friday morning, hence the Neutral bias. The Dow dropped 6 points and the other indices retracted slightly. Today we aren't dealing with a correlated market and our bias is Neutral.
Could this change? Of Course. Remember anything can happen in a volatile market.
Commentary
The markets retracted slightly on Friday and now the focus seems to be the partial government shutdown which is turning out to be the longest in US history. The shutdown will now enter its fourth week and is affecting about 800,000 Federal workers who are furloughed. The concern is that these workers may refrain from paying bills, lowering their credit scores and overall indirectly slowing down the economy. I personally think this is a bit overblown with many pundits attempting to add drama to the situation. Obviously if it continues it will have an impact but I think that finance and credit should take this into consideration if their client is a Federal employee. Clearly these folks didn't cause the situation and if the situation were rectified there wouldn't be a problem. But as in all things, time will tell how it all works out.
Author

Nick Mastrandrea
Market Tea Leaves


