Markets Continue its Downward Spiral [Video]
![Markets Continue its Downward Spiral [Video]](https://editorial.fxstreet.com/images/Markets/Equities/stock-certificates-11742678_XtraLarge.jpg)
US Dollar: Dec USD is Up at 97.725.
Energies: Jan'20 Crude is Up at 56.76.
Financials: The Mar'20 30 year bond is Down 18 ticks and trading at 157.17.
Indices: The Dec S&P 500 emini ES contract is 40 ticks Higher and trading at 3101.00.
Gold: The Feb'20 Gold contract is trading Down at 1481.60. Gold is 28 ticks Lower than its close.
Initial Conclusion
This is not a correlated market. The dollar is Up+ and Crude is Up+ which is not normal but the 30 year Bond is trading Lower. The Financials should always correlate with the US dollar such that if the dollar is lower then bonds should follow and vice-versa. The S&P is Higher and Crude is trading Higher which is not correlated. Gold is trading Lower which is correlated with the US dollar trading Up. I tend to believe that Gold has an inverse relationship with the US Dollar as when the US Dollar is down, Gold tends to rise in value and vice-versa. Think of it as a seesaw, when one is up the other should be down. I point this out to you to make you aware that when we don't have a correlated market, it means something is wrong. As traders you need to be aware of this and proceed with your eyes wide open.
At this time all of Asia is trading mainly Lower with the exception of the Indian Sensex exchange which is Higher at this time. Currently all of Europe is trading Higher.
Possible Challenges To Traders Today:
-
ADP Non-Farm Employment Change is out at 8:15 AM. This is Major.
-
Final Services is out at 9:45 AM EST. This is Major.
-
ISM Non-Manufacturing PMI is out at 10 AM EST. This is Major.
-
FOMC Member Quarles Speaks at 10 AM EST. This is Major.
-
Crude Oil Inventories is out at 10:30 AM EST. This is Major.
Treasuries
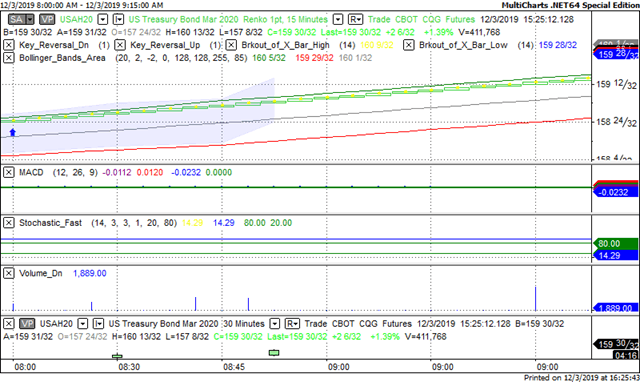
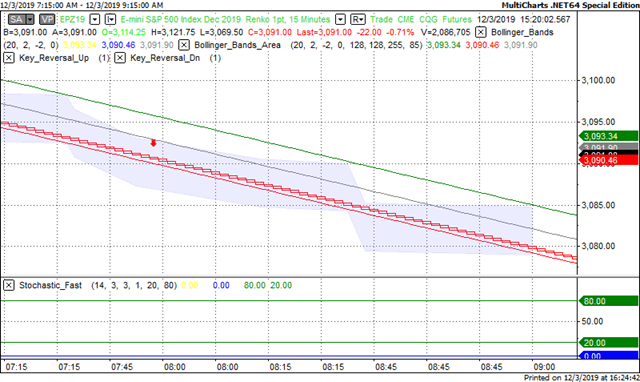
We've elected to switch gears a bit and show correlation between the 30 year bond (ZB) and The S&P futures contract. The S&P contract is the Standard and Poor's and the purpose is to show reverse correlation between the two instruments. Remember it's liken to a seesaw, when up goes up the other should go down and vice versa.
Yesterday the ZB made a major move at around 8 AM EST. The ZB hit a Low at around that time and the S&P continued on a downward spiral. If you look at the charts below ZB gave a signal at around 8 AM EST and the S&P moved Lower at the same time. Look at the charts below and you'll see a pattern for both assets. ZB hit a Low at around 8 AM and the S&P was moving Lower shortly thereafter. These charts represent the newest version of MultiCharts and I've changed the timeframe to a 15 minute chart to display better. This represented a Long opportunity on the 30 year bond, as a trader you could have netted about 20 plus ticks per contract on this trade. Each tick is worth $31.25. Please note: the front month for the ZB is now March '20. The S&P contract is still December. I've changed the format to Renko bars such that it may be more apparent and visible.
Charts Courtesy of MultiCharts built on an AMP platform
Bias
Yesterday we gave the markets a Neutral bias as the markets didn't seem to have any sense of direction yesterday morning. The Dow dropped 280 points and the other indices lost ground as well. Today we aren't dealing with a correlated market and our bias is to the Upside.
Could this change? Of Course. Remember anything can happen in a volatile market.
Commentary
Sometimes it pays to listen to a parent when they tell you something. Case in point my mother always used to say "sometimes the best words are never spoken" In other words sometimes it pays to keep your thoughts to yourself and not be so quick to divulge. Yesterday President Trump mentioned that he thought that maybe a trade deal with China could be consummated after the 2020 election, just about a year away. Well the markets didn't that news too well and went into a downward spiral whereby the Dow dropped 280 points and the other indices lost ground as well. This President at times needs to learn some diplomacy and tact. After all he is a politician.
Author

Nick Mastrandrea
Market Tea Leaves


