Markets Continue Its Descend

Good Morning Traders,
As of this writing 4 AM EST, here's what we see:
US Dollar: Sept. USD is Up at 93.365.
Energies: Sept Crude is Down at 48.29.
Financials: The Sept 30 year bond is Up 7 ticks and trading at 155.18.
Indices: The Sept S&P 500 emini ES contract is 2 ticks Lower and trading at 2437.00.
Gold: The Dec gold contract is trading Up at 1292.20. Gold is 21 ticks Higher than its close.
Initial Conclusion
This is not a correlated market. The dollar is Up+ and Crude is Down- which is normal but the 30 year Bond is trading Higher. The Financials should always correlate with the US dollar such that if the dollar is lower then bonds should follow and vice-versa. The indices are Down- and Crude is trading Down- which is not correlated. Gold is trading Up which is not correlated with the US dollar trading Up+. I tend to believe that Gold has an inverse relationship with the US Dollar as when the US Dollar is down, Gold tends to rise in value and vice-versa. Think of it as a seesaw, when one is up the other should be down. I point this out to you to make you aware that when we don't have a correlated market, it means something is wrong. As traders you need to be aware of this and proceed with your eyes wide open.
At this hour all of Asia is trading Lower. At this hour Europe is also trading Higher.
Possible Challenges To Traders Today
– CPI m/m is out at 8:30 AM EST. This is major.
– Core CPI is out at 8:30 AM. This is major.
– FOMC Member Kaplan Speaks at 9:40 AM EST. This is major.
– FOMC Member Kashkari Speaks at 11:30 AM EST. This is major.
Treasuries
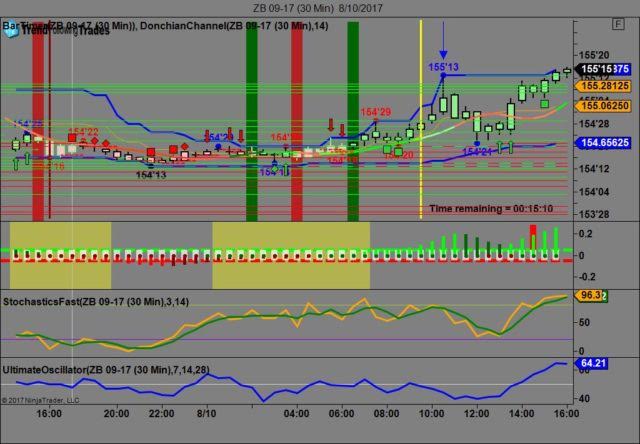
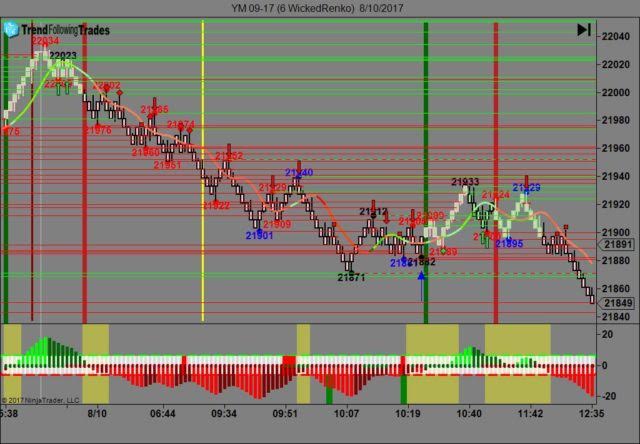
We've elected to switch gears a bit and show correlation between the 30 year bond (ZB) and The YM futures contract. The YM contract is the DJIA and the purpose is to show reverse correlation between the two instruments. Remember it's liken to a seesaw, when up goes up the other should go down and vice versa.
Yesterday the ZB made it's move at around 10:30 AM EST with no economic news in sight. The ZB hit a High at around that time and the YM hit a Low. If you look at the charts below ZB gave a signal at around 10:30 AM and the YM was moving Higher at the same time. Look at the charts below and you'll see a pattern for both assets. ZB hit a High at around 10:30 AM and the YM hit a Low. These charts represent the newest version of Trend Following Trades and I've changed the timeframe to a 30 minute chart to display better. This represented a Shorting opportunity on the 30 year bond, as a trader you could have netted about 20 plus ticks per contract on this trade. Each tick is worth $31.25. We added a Donchian Channel to the charts to show the signals more clearly. Please note that the front month for the ZB contract is now September, 2017.
Charts Courtesy of Trend Following Trades built on a NinjaTrader platform
Bias
Yesterday we gave the markets a downside bias as the USD, Crude and Gold were all trading higher yesterday morning and this usually reflects a downside trend for the indices. The Dow dropped 205 points and the other indices lost ground as well. Today we aren't dealing with a correlated market and will maintain a downside bias.
Could this change? Of Course. Remember anything can happen in a volatile market.
Commentary
It seems as though North Korea is still front and center in the news as the markets were driven down again by the news that neither threat (either North Korean or American) was considered "tough enough". The North Koreans have already stated that they intend to launch 4 missiles by the middle of the month but that they will fall short of its intended target (Guam). Doesn't matter. They still fired upon US sovereign territory and should they do so the United States will be forced to take immediate action upon North Korea. This is rapidly moving from a war of words to one of action as all this saber rattling lock each side into a corner with no room to maneuver. This is how wars get started. It happened in 1914 with World War One, it happened in 1939 with World War Two and it almost happened in 1962 with the Cuban Missile Crisis but as we've stated previously cooler minds prevailed. We can only hope that somehow cooler minds will prevail here.
Author

Nick Mastrandrea
Market Tea Leaves


